Process Flowchart
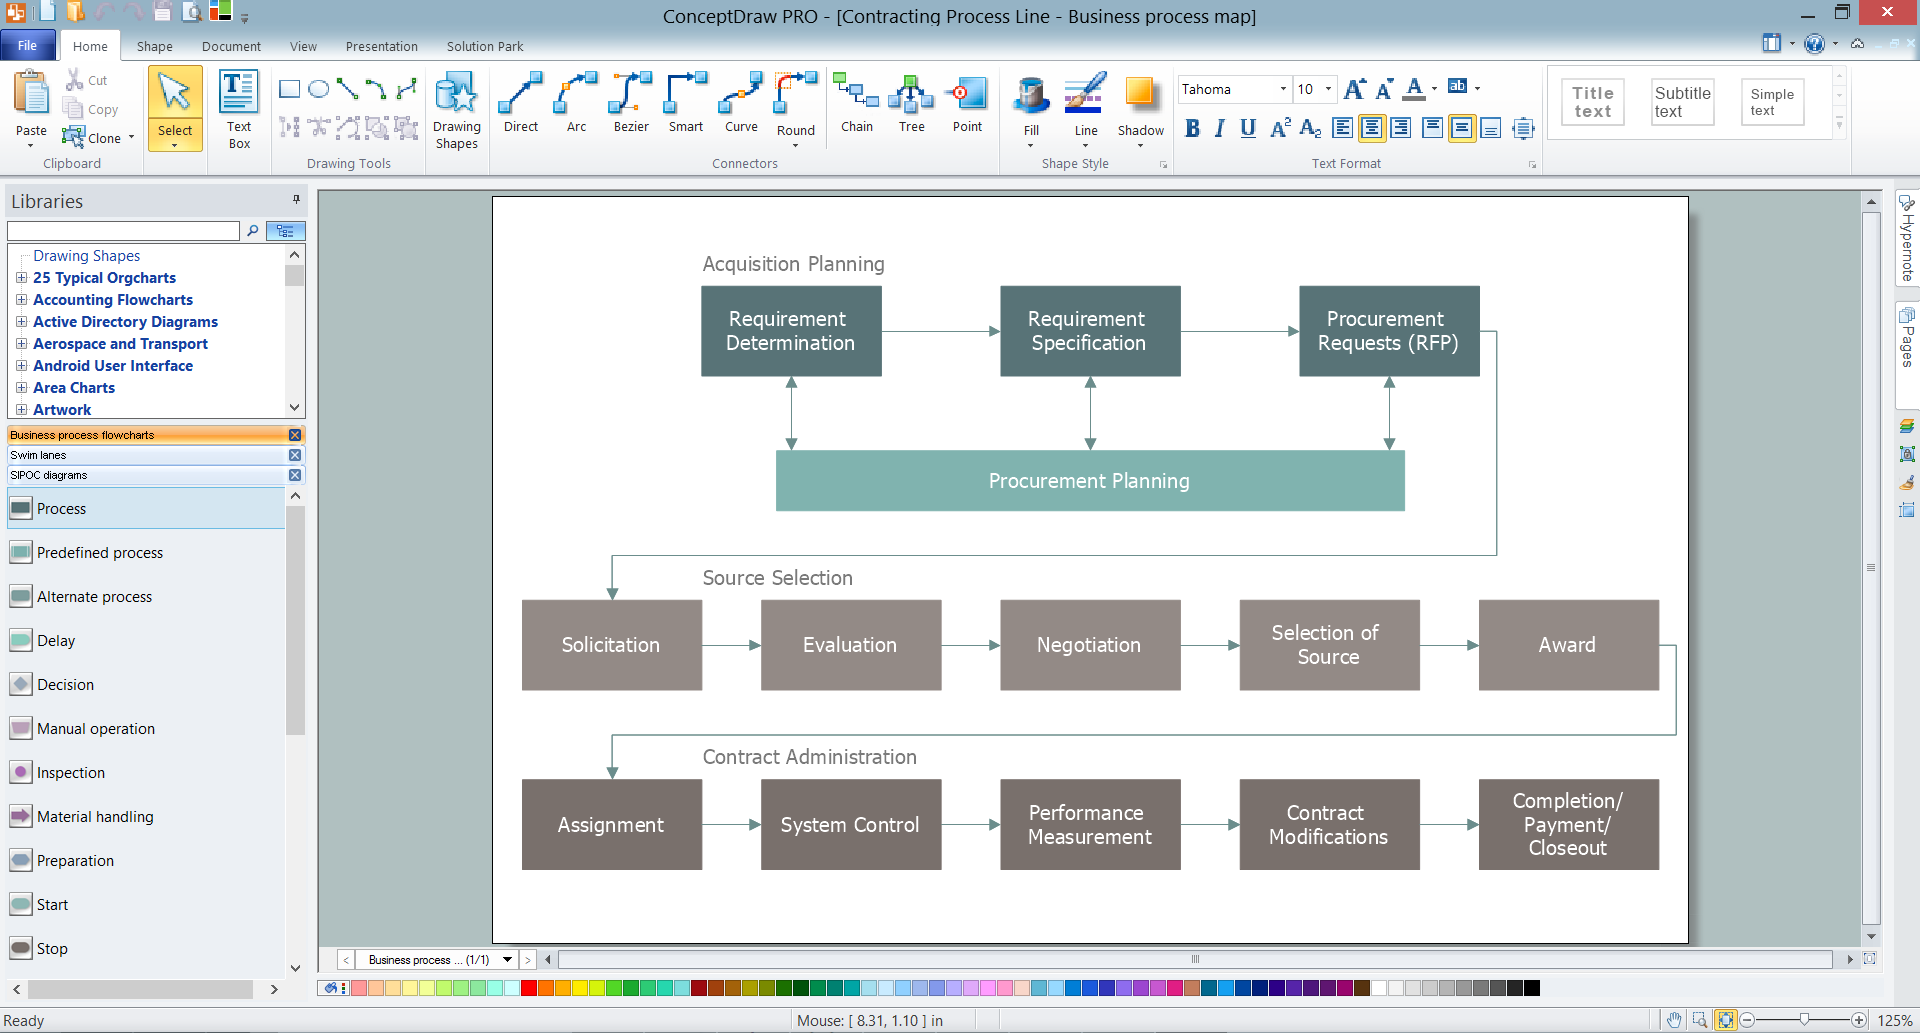
The main reason of using Process Flowchart or PFD is to show relations between major parts of the system. Process Flowcharts are used in process engineering and chemical industry where there is a requirement of depicting relationships between major components only and not include minor parts. Process Flowcharts for single unit or multiple units differ in their structure and implementation. ConceptDraw PRO is Professional business process mapping software for making Process flowcharts, Process flow diagram, Workflow diagram, flowcharts and technical illustrations for business documents and also comprehensive visio for mac application. Easier define and document basic work and data flows, financial, production and quality management processes to increase efficiency of your business with ConcepDraw PRO. Business process mapping software with Flowchart Maker ConceptDraw PRO includes extensive drawing tools, rich examples and templates, process flowchart symbols and shape libraries, smart connectors that allow you create the flowcharts of complex processes, process flow diagrams, procedures and information exchange. Process Flowchart Solution is project management workflow tools which is part ConceptDraw Project marketing project management software. Drawing charts, diagrams, and network layouts has long been the monopoly of Microsoft Visio, making Mac users to struggle when needing such visio alternative like visio for mac, it requires only to view features, make a minor edit to, or print a diagram or chart. Thankfully to MS Visio alternative like ConceptDraw PRO software, this is cross-platform charting and business process management tool, now visio alternative for making sort of visio diagram is not a problem anymore however many people still name it business process visio tools.
How to draw Metro Map style infographics? Moscow, New York, Los Angeles, London
The solution handles designs of any complexity, and the comprehensive library covers all key aspects of a transportation system. To further enhance your map design, there is the option to embed links, that can display station images or other relevant, important information. We have also included a set of samples in the solution, that show the possible real-world application — complex tube systems including the London Tube and New York City Subway show the level of detail possible when using the Metro Map Solution.Best Value Stream Mapping mac Software
Create value stream maps - for value stream analysis and value stream management, material and information flow mapping, using our quick start templates included with ConceptDraw.
 Value Stream Mapping
Value stream mapping solution extends ConceptDraw PRO software with templates, samples and vector stencils for drawing the Value Stream Maps (VSM) in lean manufacturing practice.
Cross-Functional Process Map Template
When you need a drawing software to create a professional looking cross-functional charts, ConceptDraw with its Arrows10 Technology - is more than enough versatility to draw any type of diagram with any degree of complexity. Use templates with process maps, diagrams, charts to get the drawing in minutes.HelpDesk
How to Draw a Map of USA States Using ConceptDraw PRO
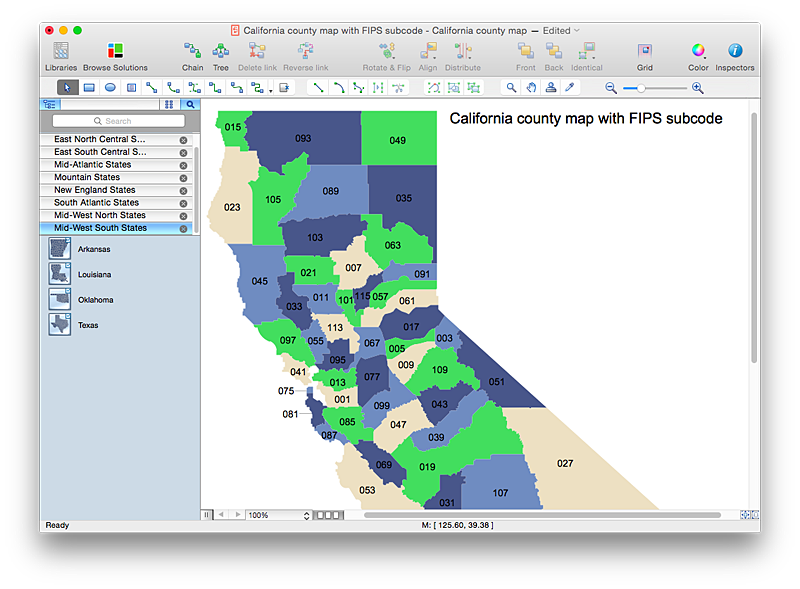
You can found a huge set of geopolitical statistical data regarding America. A common way of visualizing this data is to create maps that connect a particular data in relation to a specific geographical area. Thematic maps are used to depict such data as population density, average rainfall, or political allegiance, representing the data by using visual elements and annotation. Thematic maps always focus on one particular subject matter unlike general reference maps, which display information on a different subjects — vegetation, topology, roads and highways, etc. The United States Mapping Solution for ConceptDraw PRO includes all of the US States with county outlined borders, from the largest, San Bernardino in California, to the smallest Kalawao County, Hawaii.Cross-Functional Flowchart
Use of Cross-Functional Flowchart is a clear way of showing each team member’s responsibilities and how processes get shared or transferred between different responsible people, teams and departments. Use the best flowchart maker ConceptDraw PRO with a range of standardized cross-functional flowchart symbols to create the Cross-Functional Flowcharts simply and to visualize the relationship between a business process and the functional units responsible for that process. To draw the most quickly Cross-Functional Flowcharts, Cross Functional Process Maps, or Cross Functional Process Flow Diagrams, start with a Cross-functional flowchart samples and templates from ConceptDraw Solution Park. The ConceptDraw Arrows10 and RapidDraw technologies will be also useful for you in drawing. ConceptDraw PRO supports designing both types - horizontal and vertical Cross-functional flowcharts. A vertical layout makes the accents mainly on the functional units while a horizontal layout - on the process. If you need a Visio alternative in Mac OS X, try ConceptDraw PRO. Its interface is very intuitive and it’s actually much easier to use than Visio, yet somehow it’s just as powerful if not more so. ConceptDraw PRO performs professional quality work and seamless Visio interaction.
Cross Functional Flowchart for Business Process Mapping
Start your business process mapping with conceptDraw PRO and its Arrows10 Technology. Creating a process map, also called a flowchart, is a major component of Six Sigma process management and improvement. Use Cross-Functional Flowchart drawing software for business process mapping (BPM). Use a variety of drawing tools, smart connectors and shape libraries to create flowcharts of complex processes, procedures and information exchange. Define and document basic work and data flows, financial, production and quality management processes to increase efficiency of you business.Business Tools Perceptual Mapping
This sample shows the Perceptual map. It was created in ConceptDraw PRO diagramming and vector drawing software using the Matrices Solution from the Marketing area of ConceptDraw Solution Park. Perception Mapping helps organizations measure and transform all aspects of their business, people and culture. Perception Mapping allows to represent the complex relationships graphically, helps identify potential problems of the organization and make the best decisions.Business Mapping Software
Business process maps help you evaluate and manage quality in a work process chain, placing an emphasis on corporate performance and optimization. Business Mapping Software a versatile collection of libraries and templates, that allow you to create business process and SIPOC diagrams, using the Six Sigma methodology.Lean Manufacturing Diagrams
The Value Stream Mapping solution continues to extend the range of ConceptDraw PRO into a business graphics tool that can be used to document processes of Lean Manufacturing.Cross-Functional Flowchart (Swim Lanes)
Cross-Functional Flowchart is a type of chart which shows the series of process steps connected by the arrows to depict their order and applies the swim lanes to provide an extra dimension with means of assigning each process step to certain category. Often the category or the functional unit is a stakeholder (department, person, role), resource, project, phase, or any other attribute. Cross-Functional Flowcharts visually illustrate relationships between the business processes and the functional units responsible for this processes. ConceptDraw PRO is a powerful diagramming and vector drawing software for professional design Cross-Functional Flowcharts using the common notation of shapes and swim lanes. Cross-Functional Flowcharts solution included to the Business Processes area of ConceptDraw Solution Park provides numerous well-designed vector objects and connector tools for quick, easy and effective organizing information, representing process flows and relationships, and drawing Cross-Functional Flowcharts for business, science, education, technology, etc.Value Stream Mapping Symbols
VSM symbols are the best for a production process designing. The entire Value Stream Mapping method uses a graphical representation of the manufacturing process, factors' pros and cons, that all stakeholders can easily understand. Value Stream Mapping is a graphical technique that provides possibilities to improve analysis of a manufacturing process, at the stage of the transferring information or materials that required to deliver a product or service to the customer.Geo Map - Asia - Papua New Guinea
Papua New Guinea, officially named the Independent State of Papua New Guinea, is a country in Oceania that occupies the eastern half of the island of New Guinea (the western portion of the island is a part of the Indonesian provinces of Papua and West Papua) and numerous offshore islands. The vector stencils library Papua New Guinea contains contours for ConceptDraw PRO diagramming and vector drawing software. This library is contained in the Continent Maps solution from Maps area of ConceptDraw Solution Park.- Conceptdraw.com: Mind Map Software, Drawing Tools | Project ...
- Process Flowchart | Value Stream Mapping | How to draw Metro ...
- Nursing Concept Map Template Mac
- Free Value Stream Mapping For Mac
- Process Flowchart | Value Stream Mapping Symbols | Mechanical ...
- Technical Drawing Software | Best Value Stream Mapping mac ...
- Value Stream Mapping Drawing Mac
- Building Drawing Software for Design Office Layout Plan | Value ...
- How Can I Draw Concept Maps For Solutions
- Vector Map of Germany | MTA Subway Map | Value Stream Mapping ...
- Process Flowchart | Value Stream Mapping Symbols | Mechanical ...
- Map Of A Computers System
- Business Mapping Example Or Drawing
- Drawing A Timeline In Business Process Mapping
- Best Value Stream Mapping mac Software | Technical Drawing ...
- Geo Mapping Software Examples - World Map Outline | Geo Map ...
- Draw Concept Map Online
- Quality Mind Map Solution | Best Value Stream Mapping mac ...
- Concept Maps | Simple Diagramming | Simple Drawing Applications ...
- Draw Travel Map Software


