Design Elements for UML Diagrams

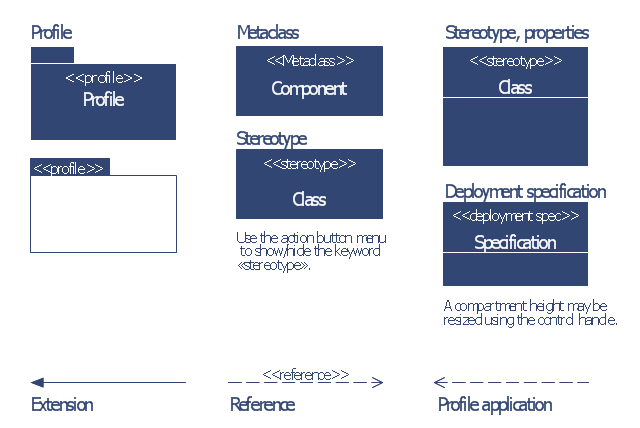
The vector stencils library "Bank UML profile diagram" contains 9 shapes for drawing UML profile diagrams.
Use it for object-oriented modeling of your bank information system.
"A profile diagram operates at the metamodel level to show stereotypes as classes with the <> stereotype, and profiles as packages with the <> stereotype. The extension relation (solid line with closed, filled arrowhead) indicates what metamodel element a given stereotype is extending." [Profile diagram. Wikipedia]
This example of UML profile diagram symbols for the ConceptDraw PRO diagramming and vector drawing software is included in the ATM UML Diagrams solution from the Software Development area of ConceptDraw Solution Park.
Use it for object-oriented modeling of your bank information system.
"A profile diagram operates at the metamodel level to show stereotypes as classes with the <
This example of UML profile diagram symbols for the ConceptDraw PRO diagramming and vector drawing software is included in the ATM UML Diagrams solution from the Software Development area of ConceptDraw Solution Park.
UML profile diagram symbols
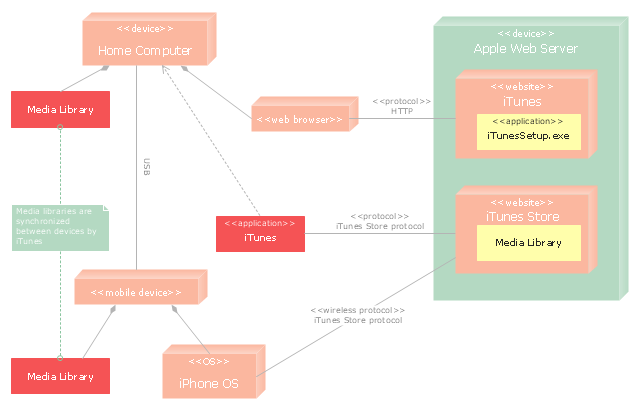
"iTunes is a media player, media library, and mobile device management application developed by Apple Inc. It is used to play, download, and organize digital audio and video on personal computers running the OS X and Microsoft Windows operating systems. The iTunes Store is also available on the iPod Touch, iPhone, and iPad.
Through the iTunes Store, users can purchase and download music, music videos, television shows, audiobooks, podcasts, movies, and movie rentals in some countries, and ringtones, available on the iPhone and iPod Touch (fourth generation onward). Application software for the iPhone, iPad and iPod Touch can be downloaded from the App Store." [iTunes. Wikipedia]
The UML deployment diagram example "Apple iTunes" was created using the ConceptDraw PRO diagramming and vector drawing software extended with the Rapid UML solution from the Software Development area of ConceptDraw Solution Park.
UML deployment diagram
Entity Relationship Diagrams

UML Diagram Tool

Pyramid Chart Examples

Visualize Stakeholder Analysis

Bar Diagrams for Problem Solving. Create manufacturing and economics bar charts with Bar Graphs Solution

 Entity-Relationship Diagram (ERD)
An Entity-Relationship Diagram (ERD) is a visual presentation of entities and relationships. That type of diagrams is often used in the semi-structured or unstructured data in databases and information systems. At first glance ERD is similar to a flowch
Bar Diagrams for Problem Solving. Create economics and financial bar charts with Bar Graphs Solution

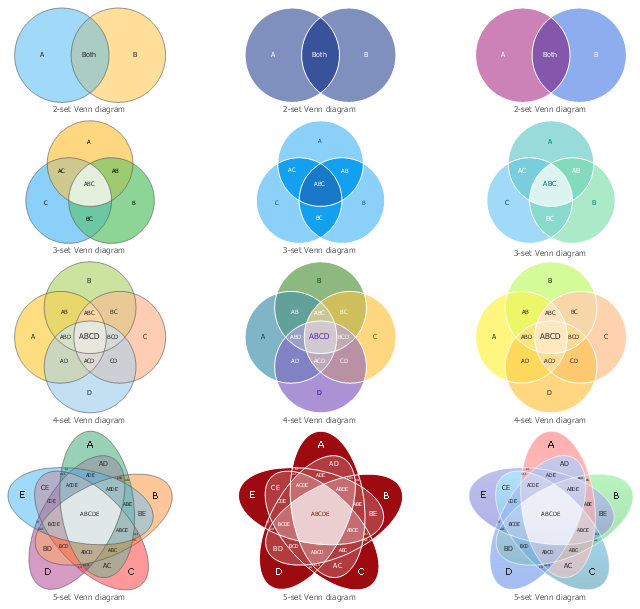
The vector stencils library "Venn diagrams" contains 12 templates. Use it for drawing Venn and Euler diagrams.
"A Venn diagram (also called a set diagram or logic diagram) is a diagram that shows all possible logical relations between a finite collection of different sets. Typically overlapping shapes, usually circles, are used, and an area-proportional or scaled Venn diagram is one in which the area of the shape is proportional to the number of elements it contains. These diagrams represent elements as points in the plane, and sets as regions inside curves. An element is in a set S just in case the corresponding point is in the region for S. They are thus a special case of Euler diagrams, which do not necessarily show all relations. Venn diagrams were conceived around 1880 by John Venn. They are used to teach elementary set theory, as well as illustrate simple set relationships in probability, logic, statistics, linguistics and computer science." [Venn diagram. Wikipedia]
The templates example "Design elements - Venn diagrams" was created using the ConceptDraw PRO diagramming and vector drawing software extended with the Venn Diagrams solution from the area "What is a Diagram" of ConceptDraw Solution Park.
Venn diagram templates
Process Flow Diagrams

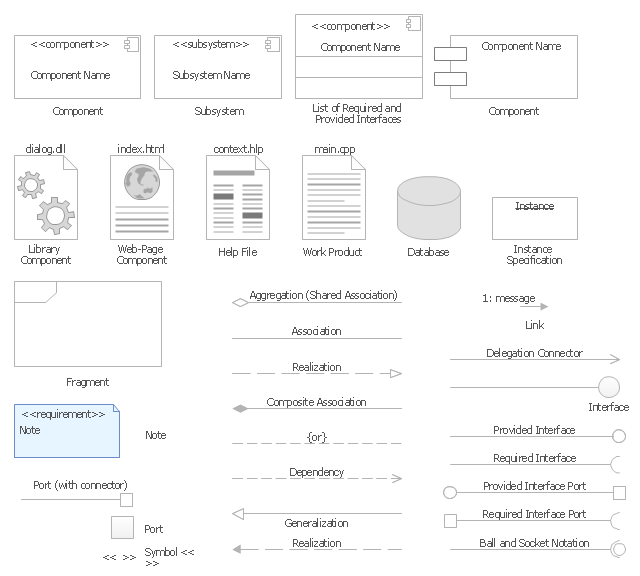
The vector stencils library "UML component diagrams" contains 36 symbols for the ConceptDraw PRO diagramming and vector drawing software.
"In the Unified Modeling Language, a component diagram depicts how components are wired together to form larger components and or software systems. They are used to illustrate the structure of arbitrarily complex systems. ...
Symbols.
This may have a visual stereotype in the top right of the rectangle of a small rectangle with two even smaller rectangles jutting out on the left.
The lollipop, a small circle on a stick represents an implemented or provided interface. The socket symbol is a semicircle on a stick that can fit around the lollipop. This socket is a dependency or needed interface." [Component diagram. Wikipedia]
The example "Design elements - UML component diagrams" is included in the Rapid UML solution from the Software Development area of ConceptDraw Solution Park.
UML component diagram symbols
Sun Solar System

What Is a Circle Spoke Diagram

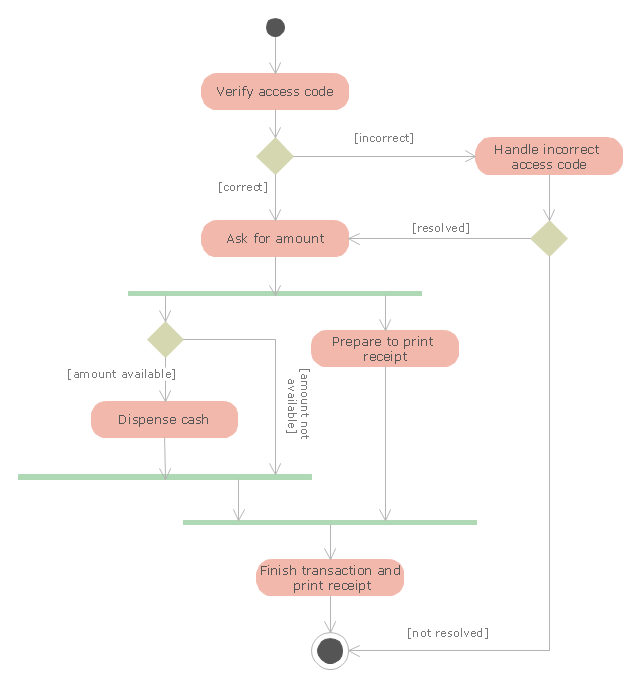
"An automated teller machine or automatic teller machine" (ATM) (American, Australian, Singaporean, Indian, and Hiberno-English), also known as an automated banking machine (ABM) (Canadian English), cash machine, cashpoint, cashline or hole in the wall (British, South African, and Sri Lankan English), is an electronic telecommunications device that enables the clients of a financial institution to perform financial transactions without the need for a cashier, human clerk or bank teller.
On most modern ATMs, the customer is identified by inserting a plastic ATM card with a magnetic stripe or a plastic smart card with a chip that contains a unique card number and some security information such as an expiration date or CVVC (CVV). Authentication is provided by the customer entering a personal identification number (PIN). The newest ATM at Royal Bank of Scotland allows customers to withdraw cash up to £100 without a card by inputting a six-digit code requested through their smartphones.
Using an ATM, customers can access their bank accounts in order to make cash withdrawals, get debit card cash advances, and check their account balances as well as purchase pre-paid mobile phone credit. If the currency being withdrawn from the ATM is different from that which the bank account is denominated in (e.g.: Withdrawing Japanese yen from a bank account containing US dollars), the money will be converted at an official wholesale exchange rate. Thus, ATMs often provide one of the best possible official exchange rates for foreign travellers, and are also widely used for this purpose." [Automated teller machine. Wikipedia]
The UML activity diagram example "Cash withdrawal from ATM" was created using the ConceptDraw PRO diagramming and vector drawing software extended with the Rapid UML solution from the Software Development area of ConceptDraw Solution Park.
UML activity diagram
 Cisco Network Diagrams
Cisco Network Diagrams solution extends ConceptDraw DIAGRAM with the best characteristics of network diagramming software. Included samples, templates and libraries of built-in standardized vector Cisco network icons and Cisco symbols of computers, network devices, network appliances and other Cisco network equipment will help network engineers, network designers, network and system administrators, as well as other IT professionals and corporate IT departments to diagram efficiently the network infrastructure, to visualize computer networks topologies, to design Cisco computer networks, and to create professional-looking Cisco Computer network diagrams, Cisco network designs and schematics, Network maps, and Network topology diagrams in minutes.
"A swim lane (or swimlane) is a visual element used in process flow diagrams, or flowcharts, that visually distinguishes responsibilities for sub-processes of a business process. Swim lanes may be arranged either horizontally or vertically. In the accompanying example, the swimlanes are named Customer, Sales, Contracts, Legal, and Fulfillment, and are arranged vertically. ...
When used to diagram a business process that involves more than one department, swimlanes often serve to clarify not only the steps and who is responsible for each one, but also how delays, mistakes or cheating are most likely to occur.
Many process modeling methodologies utilize the concept of swimlanes, as a mechanism to organize activities into separate visual categories in order to illustrate different functional capabilities or responsibilities (organisational roles). Swimlanes are used in Business Process Modeling Notation (BPMN) and Unified Modeling Language activity diagram modeling methodologies." [Swim lane. Wikipedia]
The template "UML activity diagram (swimlanes)" for the ConceptDraw PRO diagramming and vector drawing software is included in the Rapid UML solution from the Software Development area of ConceptDraw Solution Park.
www.conceptdraw.com/ solution-park/ software-uml
UML activity diagram (swimlanes)
-uml-activity-diagram-(swimlanes)---template.png--diagram-flowchart-example.png)
"Crow's Foot notation is used in Barker's Notation, SSADM and Information Engineering. Crow's Foot diagrams represent entities as boxes, and relationships as lines between the boxes. Different shapes at the ends of these lines represent the cardinality of the relationship." [Entity–relationship model. Wikipedia]
The vector stencils library ERD, crow's foot notation contains 18 symbols for creating the ER-diagrams using the ConceptDraw PRO diagramming nd vector drawing software.
The example"Design elements - ERD solution (crow's foot notation)" is included in the Entity-Relationship Diagram (ERD) solution from the Software Development area of ConceptDraw Solution Park.
Crow's foot ERD
.png--diagram-flowchart-example.png)
Geo Map - Africa - Madagascar

- Bank System | Banking System | Class UML Diagram for Bank ...
- UML class diagram - Template
- Design elements - Bank UML sequence diagram | Design elements ...
- UML interaction overview diagram - Template | Design elements ...
- UML Block Diagram
- UML Class Diagram Notation | ERD Symbols and Meanings | UML ...
- UML Deployment Diagram Example
- UML composite structure diagram | UML class diagram - Template ...
- Class UML Diagram for Bank Account System | UML Class Diagram ...
- Class UML Diagram for Bank Account System | UML package ...
- UML class diagram - Template | Design elements - UML class ...
- Uml Class Diagram
- Class UML Diagram for Bank Account System | Bank UML Diagram ...
- Design elements - UML class diagrams | DFD, Yourdon and Coad ...
- UML class diagram example
- UML deployment diagram example
- UML class diagrams
- UML Component Diagram Example - Online Shopping | UML ...
- How To Make Chen ER Diagram | Entity Relationship Diagram ...
- UML Class Diagram Constructor