Sun Solar System
“The Solar System comprises the Sun and the objects that orbit it, whether they orbit it directly or by orbiting other objects that orbit it directly. Of those objects that orbit the Sun directly, the largest eight are the planets that form the planetary system around it, while the remainder are significantly smaller objects, such as dwarf planets and small Solar System bodies (SSSBs) such as comets and asteroids.
The Solar System formed 4.6 billion years ago from the gravitational collapse of a giant molecular cloud.” [from Wikipedia]
ConceptDraw DIAGRAM diagramming and vector drawing software offers the Astronomy solution with useful tools for drawing all kinds of astronomy pictures and sun solar system illustrations.

Sample 1. Astronomy Chart — Solar System Planets
Astronomy solution contains the libraries with vector objects of whole host of celestial bodies (planets, stars, galaxies), various solar system symbols, constellations, astronomy symbols. What could be easier than drag already predesigned objects from the libraries? It’s very easy and quick, and you don't need to be the painter to design professional pictures and illustrations.

Sample 2. Astronomy Solution in ConceptDraw STORE
Astronomy solution provides also a set of predesigned templates and samples that are available from ConceptDraw STORE. Using of them as the base is very useful way for drawing your own astronomy and astrology illustrations.
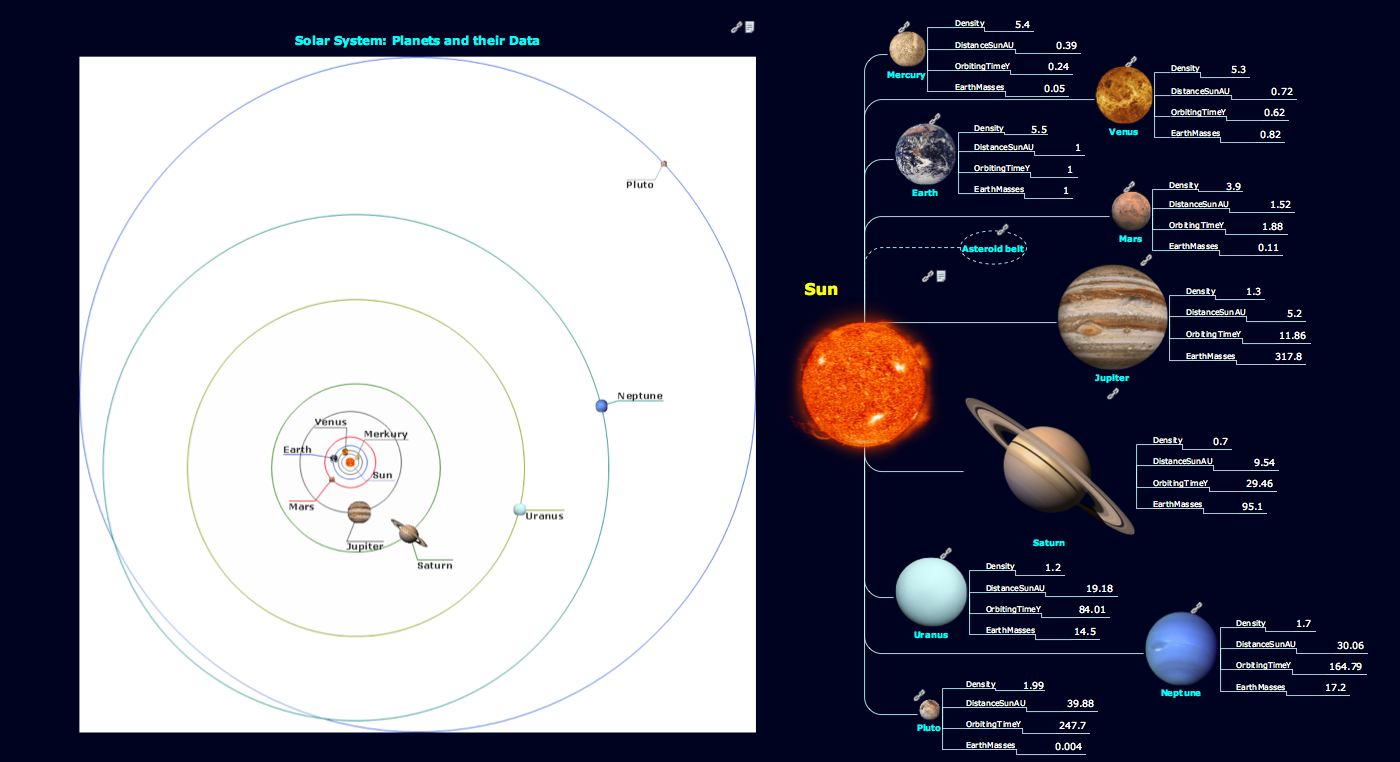
Sample 3. Astronomy Chart — Sun Solar System
This sample was created in ConceptDraw DIAGRAM using the Astronomy Solution and shows the structure of the Sun Solar System, characteristics of the planets that orbit the Sun. All planets objects used on this sample you can find in the Stars and Planets library from the Astronomy Solution.
The astronomy illustrations designed with ConceptDraw DIAGRAM are vector graphic documents and are available for reviewing, modifying, converting to a variety of formats (image, HTML, PDF file, MS PowerPoint Presentation, Adobe Flash or MS Visio), printing and send via e-mail in one moment.
FIVE RELATED HOW TO's:
You want to make an infographic and need the useful and convenient drawing tools for this? In this case the ConceptDraw DIAGRAM software extended with Education Infographics Solution is a real godsend for you.
Picture: Make an Infographic
Related Solution:
Samples, templates and libraries contain vector clip art for drawing the Aerospace Illustrations.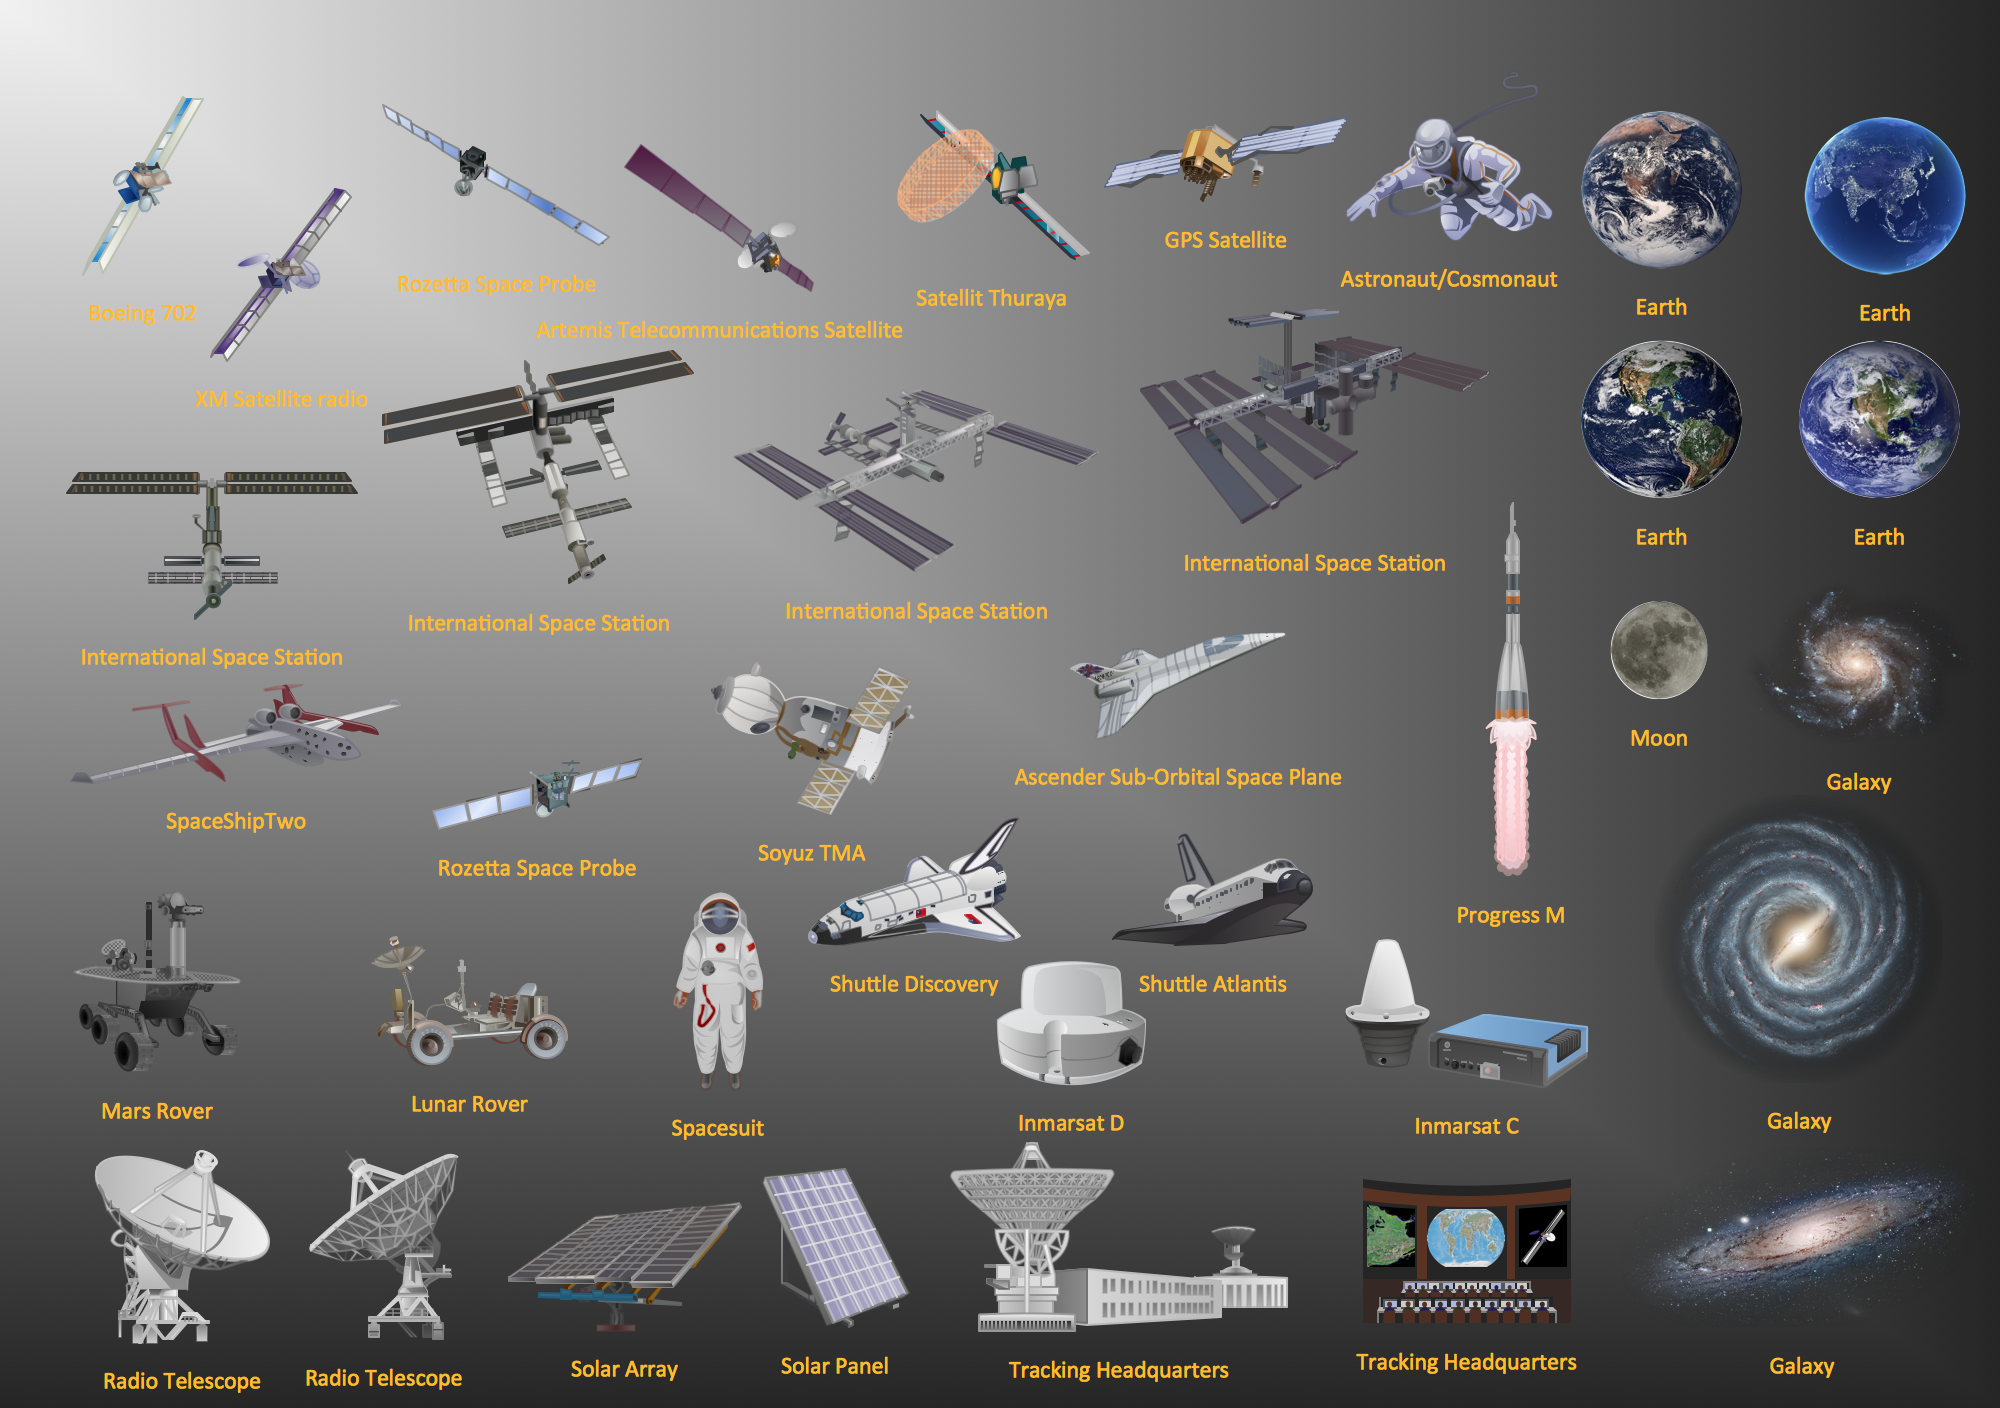
Picture: Aerospace - Design Elements
Related Solution:
Developing a software project supposes architecture first. To make it proper, you can use data flow diagram model in your current project.
The data flow diagram represents the Model of small traditional production enterprise that is made using Yourdon and Coad notation. It shows how the data is transfered through a process. According to the notation of Yourdon and Coad a process is represented by circles and data stores are drawn using parallel lines. This DFD was created using the ConceptDraw Data Flow Diagrams solution. Using this solution one can visualize data flow accordingly to the rules of two basic notations used for data flow modeling.
Picture: Data Flow Diagram Model
Related Solution:
Medical Illustrations solution including the set of professionally developed examples and samples dedicated to medicine, large variety of ready-to-use vector objects and icons of diagnostic equipment, treatment equipment, medical instruments, tools and devices, medical professionals and health workers of different medical specialties, medical procedures and patients, medical pictograms and medical symbols, among which are the famous red cross symbol, heartbeat symbol, doctor symbol, and many others, is a perfect help in questions of medical illustration and medical imaging, creation professional-looking, colorful and attractive Medical illustrations, Medical diagrams and infographics, slides for presentations in a field of medicine and health care, depicting the medical facts, the information about varied diseases and ways of medical diagnosis, methods of prevention and treatment diseases.
Picture: Medical Symbol
Related Solution:
The UML diagram is a powerful tool which lets visually represent all system's components, the interactions between them and relationships with external user interface.
The Rapid UML solution for ConceptDraw DIAGRAM software offers diversity of UML flowchart symbols for drawing all types of UML diagrams.
Picture: UML Flowchart Symbols
Related Solution:
