ERD Symbols and Meanings
Entity Relationship Diagram (ERD) is a popular software engineering tool for database modeling and illustration the logical structure of databases, which uses one of two notations - Chen's or Crow’s Foot. Crow's foot notation is effective when used in software engineering, information engineering, structured systems analysis and design. Each of these notations applies its own set of ERD symbols. Crow's foot diagrams use boxes to represent entities and lines between these boxes to show relationships. Varied shapes at the ends of lines depict the cardinality of a given relationship. Chen's ERD notation is more detailed way to represent entities and relationships. ConceptDraw DIAGRAM application enhanced with all-inclusive Entity-Relationship Diagram (ERD) solution allows design professional ER diagrams with Chen's or Crow’s Foot notation on your choice. It contains the full set of ready-to-use standardized ERD symbols and meanings helpful for quickly drawing, collection of predesigned ERD samples, examples and templates. ConceptDraw Pro is a great alternative to Visio for Mac users as it offers more features and can easily handle the most demanding professional needs.
Entity Relationship Diagram Symbols
The semantic modeling method nowadays is successfully applied in database structure design. It is effective method of modeling the data structures, which is based on the meaning of these data. As a tool of semantic modeling, there are used different types of Entity-Relationship Diagrams. Entity Relationship Diagram (ERD) is applied to visually and clearly represent a structure of a business database. The main components of ERDs are: entity, relation and attributes. An entity is a class of similar objects in the model, each entity is depicted in the form of rectangle and has the name expressed by a noun. Relation is shown in the form of non-directional line that connects two entities. There are several notation styles used for ERDs: information engineering style, Chen style, Bachman style, Martin Style. The Entity Relationship Diagram symbols used for professional ERD drawing are predesigned by professionals and collected in the libraries of the Entity-Relationship Diagram (ERD) solution for ConceptDraw DIAGRAM software.Basic Flowchart Symbols and Meaning
Flowcharts are the best for visually representation the business processes and the flow of a custom-order process through various departments within an organization. ConceptDraw DIAGRAM diagramming and vector drawing software extended with Flowcharts solution offers the full set of predesigned basic flowchart symbols which are gathered at two libraries: Flowchart and Flowcharts Rapid Draw. Among them are: process, terminator, decision, data, document, display, manual loop, and many other specific symbols. The meaning for each symbol offered by ConceptDraw gives the presentation about their proposed use in professional Flowcharts for business and technical processes, software algorithms, well-developed structures of web sites, Workflow diagrams, Process flow diagram and correlation in developing on-line instructional projects or business process system. Use of ready flow chart symbols in diagrams is incredibly useful - you need simply drag desired from the libraries to your document and arrange them in required order. There are a few serious alternatives to Visio for Mac, one of them is ConceptDraw DIAGRAM. It is one of the main contender with the most similar features and capabilities.
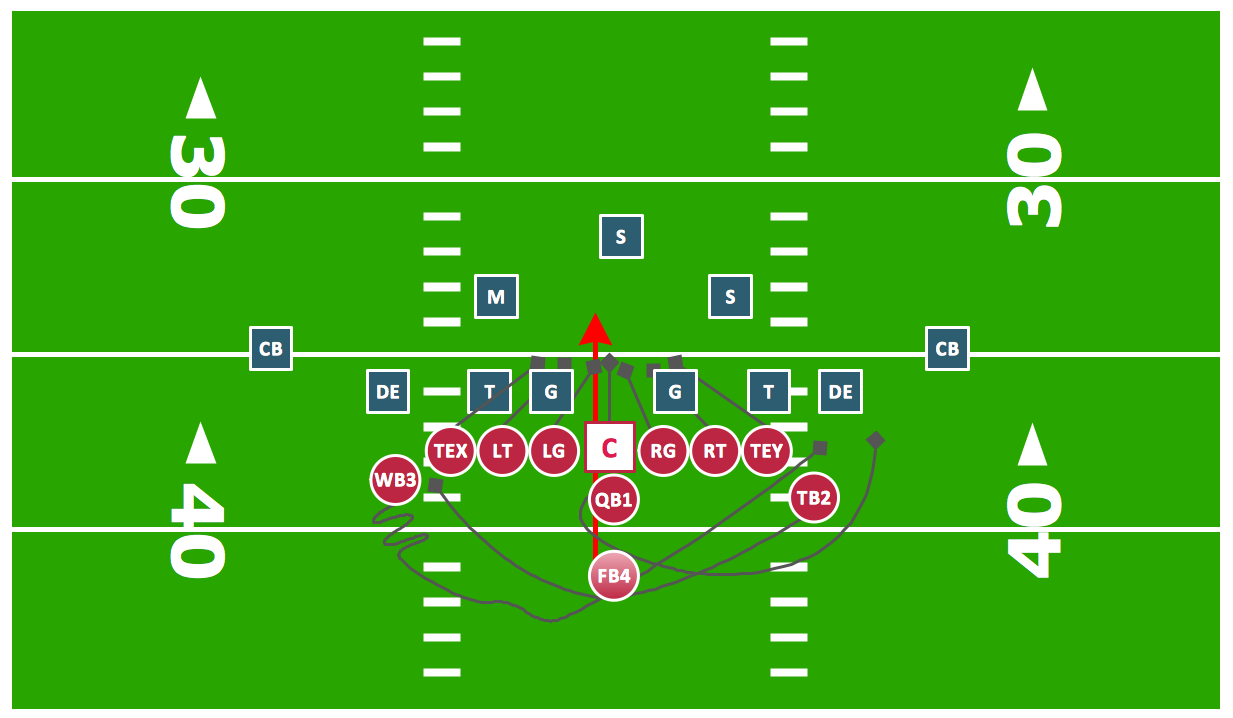
Offensive Play – Double Wing Wedge – Vector Graphic Diagram
Producing football diagrams using ConceptDraw DIAGRAM software takes seconds, not minutes. Thanks to Football solution from the Sport area of ConceptDraw Solution Park all you need is just drag and drop ready-to-use positions objects to a template contains football field, and place positions on the field.
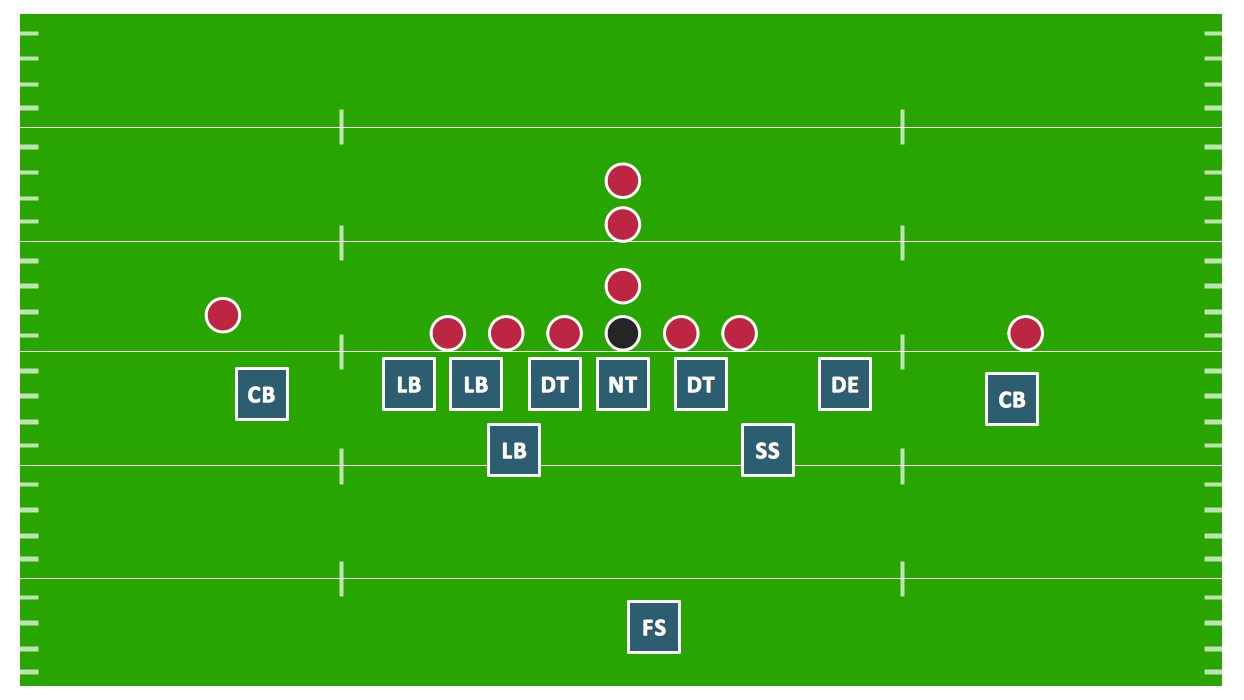
Goal Line Formation (Offense/Defense) Diagram
ConceptDraw DIAGRAM software extended with the Football solution delivers libraries, templates and samples allowing football fans or specialists to draw football-related schemas in minutes. A complete set of predesigned fields and positions make drawing schemas as quickly as possible.How To use House Electrical Plan Software
How we can conduct the electricity at house correctly without a plan? It is impossible. The House electrical diagram depicts locations of switches, outlets, dimmers and lights, and lets understand how you will connect them. But design of House Electrical Plan looks a complex task at a glance, which requires a lot of tools and special experience. But now all is simple with all-inclusive floor plan software - ConceptDraw DIAGRAM. As a house electrical plan software, the ConceptDraw DIAGRAM contains libraries with a large range of professional lighting and electrical symbols, ready-to-use electrical plans samples and examples, and built-in templates for creating great-looking Home floor electrical plans. It is a fastest way to draw Electrical circuit diagrams, Electrical wiring and Circuit schematics, Digital circuits, Electrical equipment, House electrical plans, Satellite television, Cable television, Home cinema, Closed-circuit television when are used the tools of Electric and Telecom Plans Solution from ConceptDraw Solution Park. Files created in Visio for Mac app can be easily imported to ConceptDraw DIAGRAM. Also you may import stencils and even libraries. Try for free an alternative to Visio that Apple users recommend.
HelpDesk
How to Create an IDEF3 Diagram
IDEF3 is a member of the IDEF family of modeling methods that can be used to describe operations in a business process. An IDEF3 diagram provides a description of an actual process flow within an organization or business or the changes that occur to an object within that system. This method of knowledge capture is recorded in two different perspectives - users are able to create both process schematics and object schematics using the IDEF3 schematic symbols. ConceptDraw has created a solution that collects all symbols necessary to create professional IDEF3 diagrams. IDEF methodology is suitable for almost any form of business, and for anyone who needs to record enterprise architecture in a process driven manner. The IDEF Business Process Diagram solution and ConceptDraw DIAGRAM cater to these needs, giving both beginners and experienced users the tools they need to create effective business process diagrams.
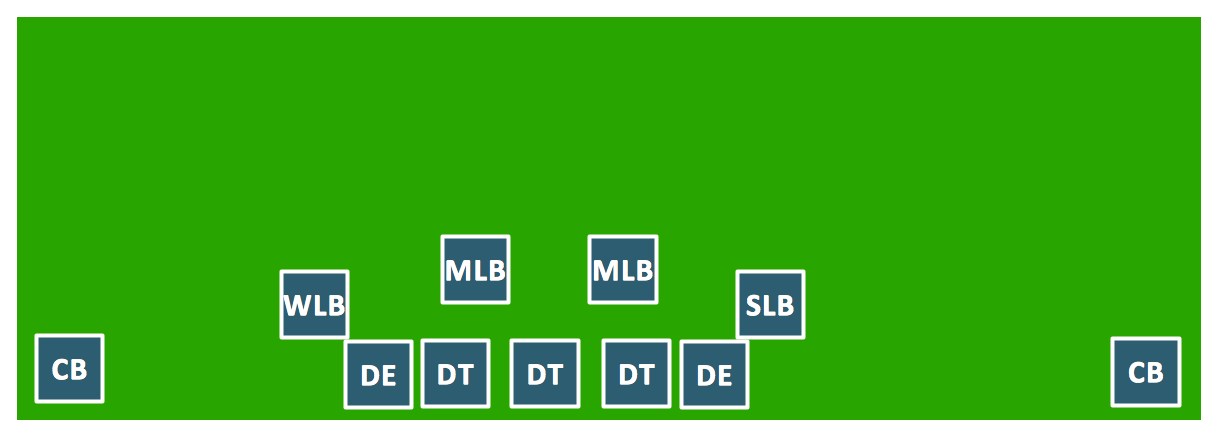
Defensive Strategy Diagram – 46 Defence
Drawing defensive strategy diagrams using ConceptDraw DIAGRAM software extended with the Football solution saves your time, and adds more value to your work. You can easily convert vector drawing to a popular graphic format and then post it to your blog or site. There is no problem to add your logo or text copyright, or use some text comments to make your diagrams unique and recognizable."Chen's notation for entity–relationship modeling uses rectangles to represent entity sets, and diamonds to represent relationships appropriate for first-class objects: they can have attributes and relationships of their own. If an entity set participates in a relationship set, they are connected with a line.
Attributes are drawn as ovals and are connected with a line to exactly one entity or relationship set.
Cardinality constraints are expressed as follows:
- a double line indicates a participation constraint, totality or surjectivity: all entities in the entity set must participate in at least one relationship in the relationship set;
- an arrow from entity set to relationship set indicates a key constraint, i.e. injectivity: each entity of the entity set can participate in at most one relationship in the relationship set;
- a thick line indicates both, i.e. bijectivity: each entity in the entity set is involved in exactly one relationship.
- an underlined name of an attribute indicates that it is a key: two different entities or relationships with this attribute always have different values for this attribute.
Attributes are often omitted as they can clutter up a diagram; other diagram techniques often list entity attributes within the rectangles drawn for entity sets." [Entity–relationship model. Wikipedia]
The vector stencils library ERD, Chen's notation contains 13 symbols for drawing entity-relatinship diagrams using the ConceptDraw PRO diagramming and vector drawing software.
The example "Design elements - ER diagram (Chen notation)" is included in the Entity-Relationship Diagram (ERD) solution from the Software Development area of ConceptDraw Solution Park.
Entity Relationship Diagram - ERD - Software for Design Crows Foot ER Diagrams
ER-model is a data model which lets describe the conceptual schemes in a specific subject area. It can help to highlight the key entities and specify relationships that can be established between these entities. During the database design, it is realized the transformation of ER model into certain database scheme based on the chosen data model (relational, object, network, etc.). There are used two notations for ERDs: Crow's Foot and Chen's. Crow's Foot notation proposed by Gordon Everest represents the entity by rectangle containing its name (name must be unique within this model), and relation - by the line which links two entities involved in relationship. The relationship's plurality is graphically indicated by a "plug" on the end of the link, the optionality - by a circle. Entity-Relationship Diagrams based on Crow's Foot notation can be easily drawn using the ConceptDraw DIAGRAM. Extended with Entity-Relationship Diagram (ERD) solution, it is the best ERD diagrams software with powerful tools and ready design elements for Crow's Foot and Chen notations.
- Er Diagram Single And Double Lines
- Eer Diagram Double Diamond
- Hvac Double Line Diagram
- Entity Relationship Diagram Symbols | ERD Symbols and Meanings ...
- In E R Diagram Double Line Indicate What
- Double Line Connector In Er Diagram
- Aerospace and Transport | Erd Double Lines Meaning
- What Is The Meaning Of Double Line In Erd
- Why Double Lines Are Using In Er Diagram
- Double Line In Er Diagram Represents