Pie Chart Software
A pie chart is a circular diagram showing a set of data divided into proportional slices. There are several variations of this chart such as donut chart, exploded pie chart, multi-level pie charts. Although it is not very informative when a ring chart or circle chart has many sections, so choosing a low number of data points is quite important for a useful pie chart. ConceptDraw PRO software with Pie Charts solution helps to create pie and donut charts for effective displaying proportions in statistics, business and mass media for composition comparison, i.e. for visualization of part percentage inside one total.Donut Chart
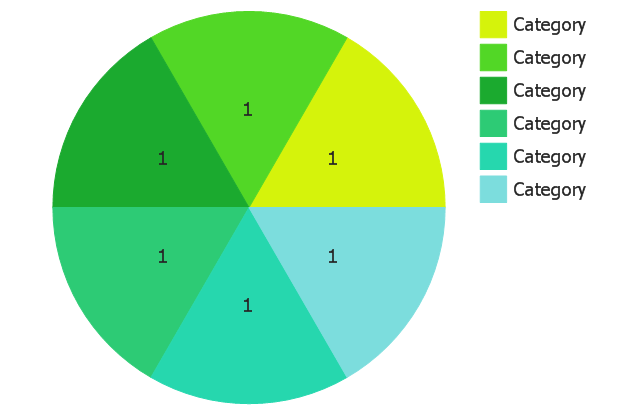
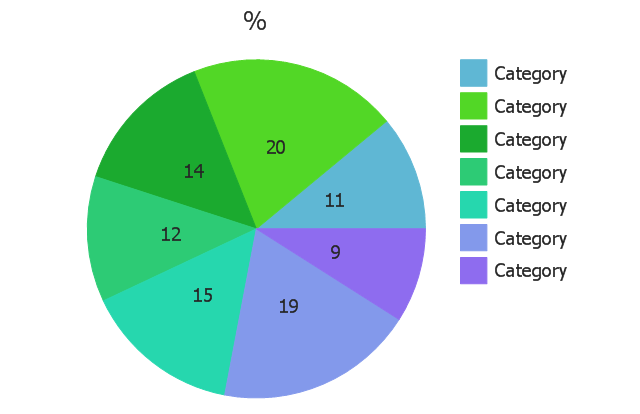
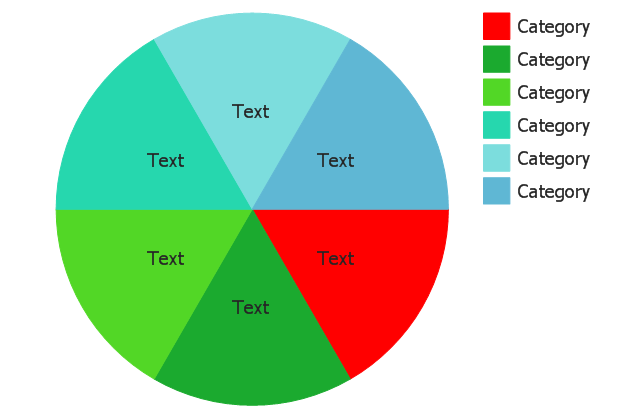
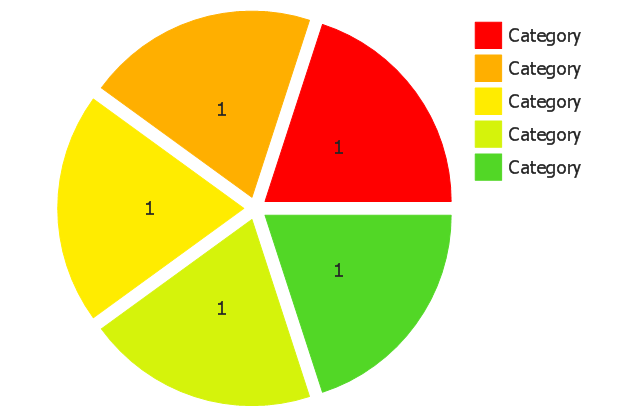
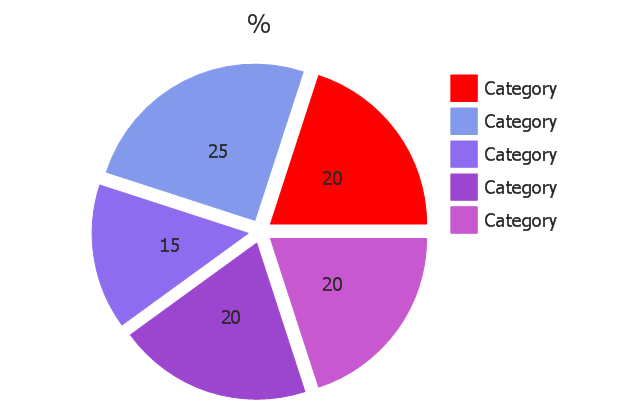
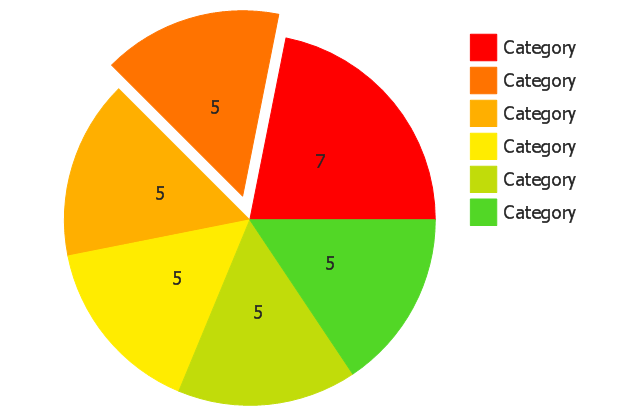
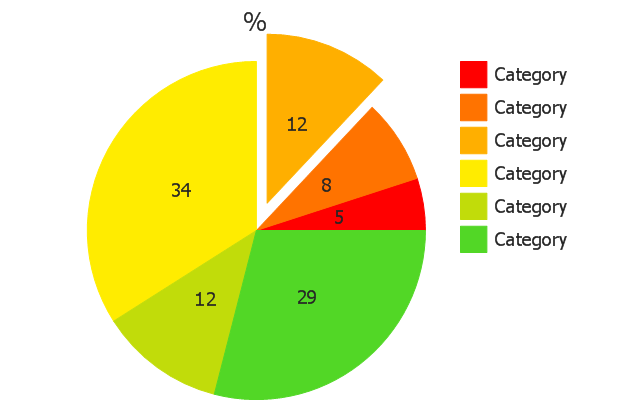
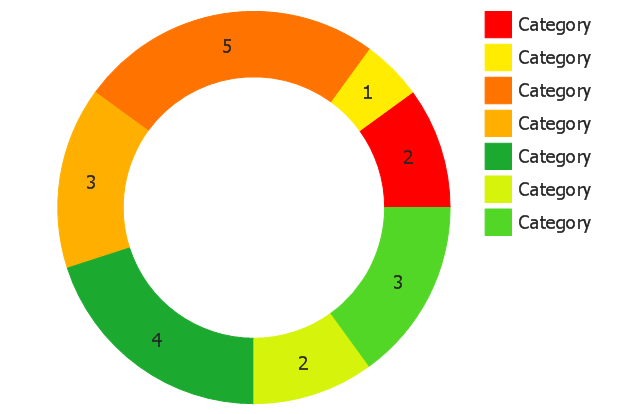
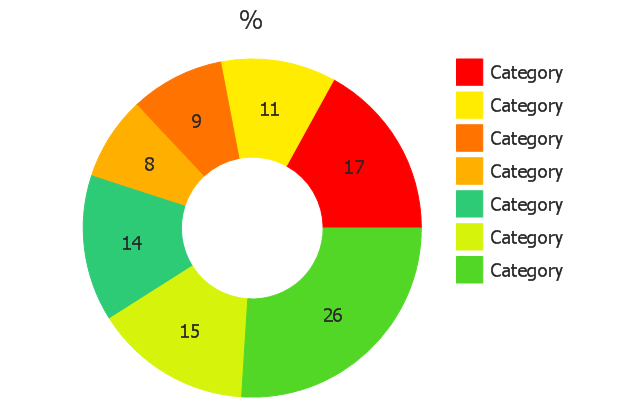
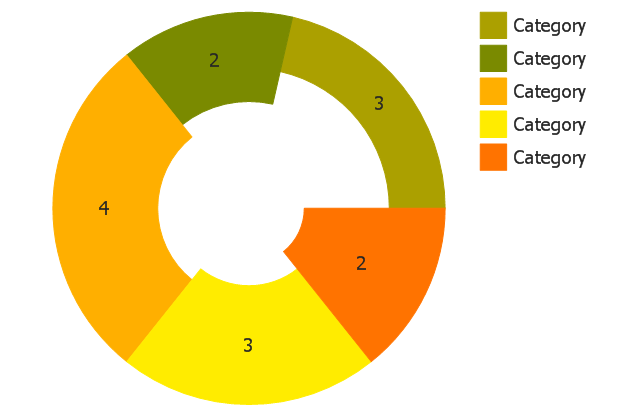
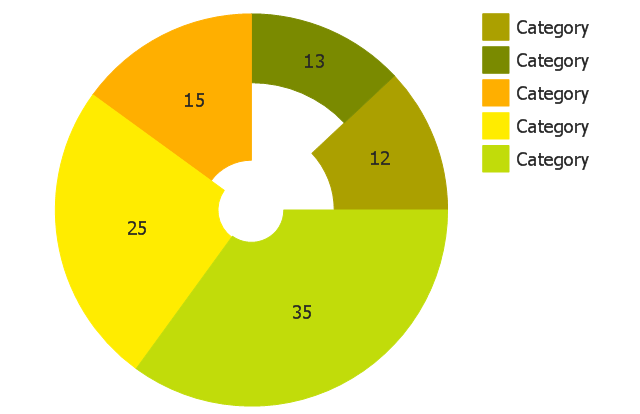
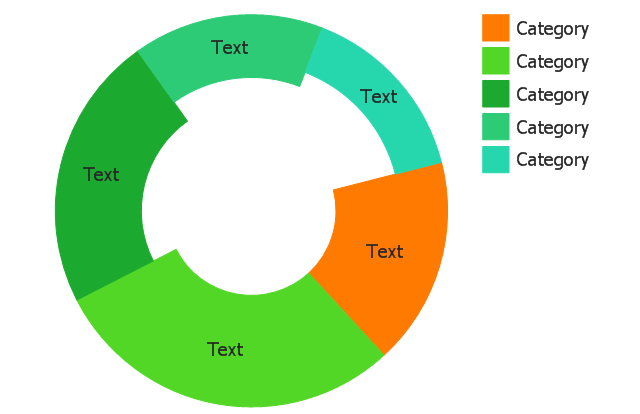
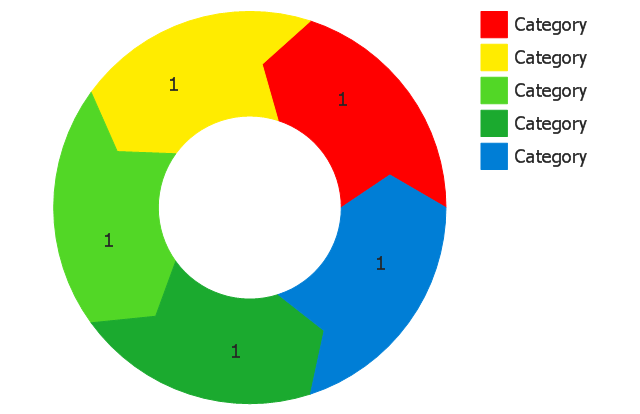
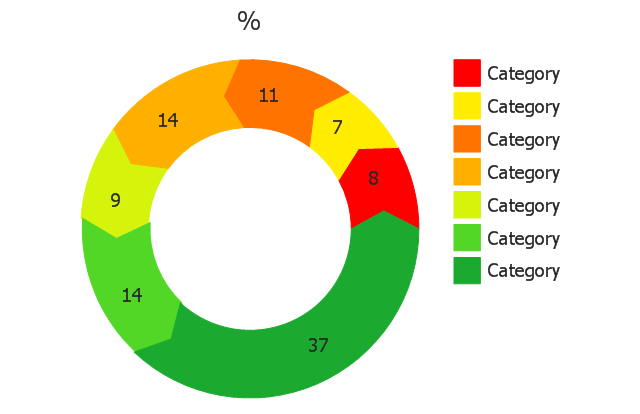
ConceptDraw PRO diagramming and vector drawing software offers the Pie Charts solution from the Graphs and Charts area which includes the tools for quick and easy designing any kind of Donut Chart.The vector stencils library "Pie charts" contains 30 templates of pie and donut (doughnut, ring) charts for visualizing percentage for parts of one total, or compare parts of few totals.
Drag a template from the library into your document and enter your data.
Use these shapes to draw your pie charts and donut charts in the ConceptDraw PRO diagramming and vector drawing software.
The vector stencils library "Pie charts" is included in the Pie Charts solution of the Graphs and Charts area in ConceptDraw Solution Park.
Percentage Pie Chart. Pie Chart Examples
This sample was created in ConceptDraw PRO diagramming and vector drawing software using the Pie Charts Solution from Graphs and Charts area of ConceptDraw Solution Park. This sample shows the Pie Chart of the approximate air composition. You can see the percentage of oxygen, nitrogen and other gases in the air visualized on this Pie Chart.How to Create a Pie Chart
Create a Pie Chart with ConceptDraw software quickly and easily. The simple tutorial helps you learn how to create a pie chart.Pie Donut Chart. Pie Chart Examples
This sample shows the Pie Donut Chart. It was created in ConceptDraw PRO diagramming and vector drawing software using the ready-to-use object from the Pie Charts Solution from Graphs and Charts area of ConceptDraw Solution Park. The Pie Donut Chart visualizes the percentage of parts of the whole and looks like as a ring divided into sectors. Pie Donut Charts are widely used in the business, statistics, analytics, mass media.Donut Chart Templates
These donut chart templates was designed using ConceptDraw PRO diagramming and vector drawing software extended with Pie Charts solution from Graphs and Charts area of ConceptDraw Solution Park. All these donut chart templates are included in the Pie Charts solution. You can quickly rework these examples into your own charts by simply changing displayed data, title and legend texts.Pie Chart Examples and Templates
A pie chart or a circle graph is a circular chart divided into sectors, illustrating numerical proportion. In a pie chart, the arc length of each sector and consequently its central angle and area, is proportional to the quantity it represents. Pie chart examples and templates created using ConceptDraw PRO software helps you get closer with pie charts and find pie chart examples suite your needs.Chart Examples
Easy charting software comes with beautiful chart templates and examples. This makes it easy to create professional charts without prior experience.Financial Comparison Chart
This sample shows the Bar Chart of the leverage ratios for two major investment banks. The leverage ratio is the ratio of the total debt to the total equity; it is a measure of the risk taken by the bank. The higher of the leverage ratio denotes the more risk, the greater risks can lead to the subprime crisis.Pie Chart Examples and Templates
A pie chart or a circle graph is a circular chart divided into sectors, illustrating numerical proportion. In a pie chart, the arc length of each sector and consequently its central angle and area, is proportional to the quantity it represents. Pie chart examples and templates created using ConceptDraw PRO software helps you get closer with pie charts and find pie chart examples suite your needs.Chart Templates
Easy charting software comes with beautiful chart templates and examples. This makes it easy to create professional charts without prior experience.Business Report Pie. Pie Chart Examples
This sample shows the Business Report Pie Chart. The Pie Chart visualizes the data as the proportional parts of a whole, illustrates the numerical proportion. Pie Charts are very useful in the business, statistics, analytics, mass media.Percentage Spider Chart
ConceptDraw PRO creates drawings, diagrams and charts with great visual appeal in Mac OS X. This sample shows the Spider Chart that represents the buyer perceptions of the leather footwear industries in Brazil, India and Italy.Draw Company Structure with Organization Charting Software
Draw Company Structure Diagram - get the detailed information about the company structure and hierarchy - who execute what tasks and who is in charge at this company. This information shows the reasoning and success of business and is indispensable for investors and financial institutions.
- Pie Donut Chart. Pie Chart Examples | Donut Chart | Percentage Pie ...
- Draw A Pie Chart Showing Different Gases And Their Percentage In
- Donut Chart Templates | Percentage Pie Chart. Pie Chart Examples ...
- Donut Chart Percentage
- Percentage Pie Chart. Pie Chart Examples | Pie Donut Chart. Pie ...
- Pie Chart Examples and Templates | Percentage Pie Chart. Pie ...
- Pie Donut Chart. Pie Chart Examples | Percentage Pie Chart. Pie ...
- Percent Donut Chart
- Percentage Pie Chart. Pie Chart Examples | Donut Chart | Pie Chart ...
- How Much Each Sector Contribute Percentage In Pie Chart Form
- Basic Pie Charts | Percentage Pie Chart. Pie Chart Examples | Pie ...
- Percentage Air
- Donut Chart
- Pie Chart Software | Percentage Pie Chart. Pie Chart Examples | Pie ...
- Donut Percentages
- Oxygen Circle Percentage Chart
- Percentage Of Oxygen In The Air In A Pie Chart
- Pie Chart Examples and Templates | Percentage Pie Chart. Pie ...
- Percentage Pie Chart. Pie Chart Examples | Pie Chart Software | Pie ...
- Percentages Of Gases In Air


-pie-charts---vector-stencils-library.png--diagram-flowchart-example.png)
-pie-charts---vector-stencils-library.png--diagram-flowchart-example.png)
-pie-charts---vector-stencils-library.png--diagram-flowchart-example.png)
-pie-charts---vector-stencils-library.png--diagram-flowchart-example.png)
,-control-dots-pie-charts---vector-stencils-library.png--diagram-flowchart-example.png)
-pie-charts---vector-stencils-library.png--diagram-flowchart-example.png)
-pie-charts---vector-stencils-library.png--diagram-flowchart-example.png)
-pie-charts---vector-stencils-library.png--diagram-flowchart-example.png)
-pie-charts---vector-stencils-library.png--diagram-flowchart-example.png)
-pie-charts---vector-stencils-library.png--diagram-flowchart-example.png)
-pie-charts---vector-stencils-library.png--diagram-flowchart-example.png)
-2-pie-charts---vector-stencils-library.png--diagram-flowchart-example.png)
-2-pie-charts---vector-stencils-library.png--diagram-flowchart-example.png)
,-control-dots-pie-charts---vector-stencils-library.png--diagram-flowchart-example.png)
-pie-charts---vector-stencils-library.png--diagram-flowchart-example.png)
-pie-charts---vector-stencils-library.png--diagram-flowchart-example.png)


