Types of Flowcharts
A Flowchart is a graphical representation of process, algorithm, workflow or step-by-step solution of the problem. It shows the steps as boxes of various kinds and connects them by arrows in a defined order depicting a flow. There are twelve main Flowchart types: Basic Flowchart, Business Process Modeling Diagram (BPMN), Cross Functional Flowchart, Data Flow Diagram (DFD), IDEF (Integrated DEFinition) Flowchart, Event-driven Process Chain (EPC) Diagram, Influence Diagram (ID), Swimlane Flowchart, Process Flow Diagram (PFD), Specification and Description Language (SDL) Diagram, Value Stream Mapping, Workflow Diagram. Using the Flowcharts solution from the Diagrams area of ConceptDraw Solution Park you can easy and quickly design a Flowchart of any of these types. This solution offers a lot of special predesigned vector symbols for each of these widely used notations. They will make the drawing process of Flowcharts much easier than ever. Pay also attention for the included collection of ready Flowchart examples, samples and quick-start templates. This is business process improvement tools. If you are looking for MS Visio for your Mac, then you are out of luck, because it hasn't been released yet. However, you can use Visio alternatives that can successfully replace its functions. ConceptDraw DIAGRAM is an alternative to MS Visio for Mac that provides powerful features and intuitive user interface for the same.
Building Drawing Software for Design Seating Plan
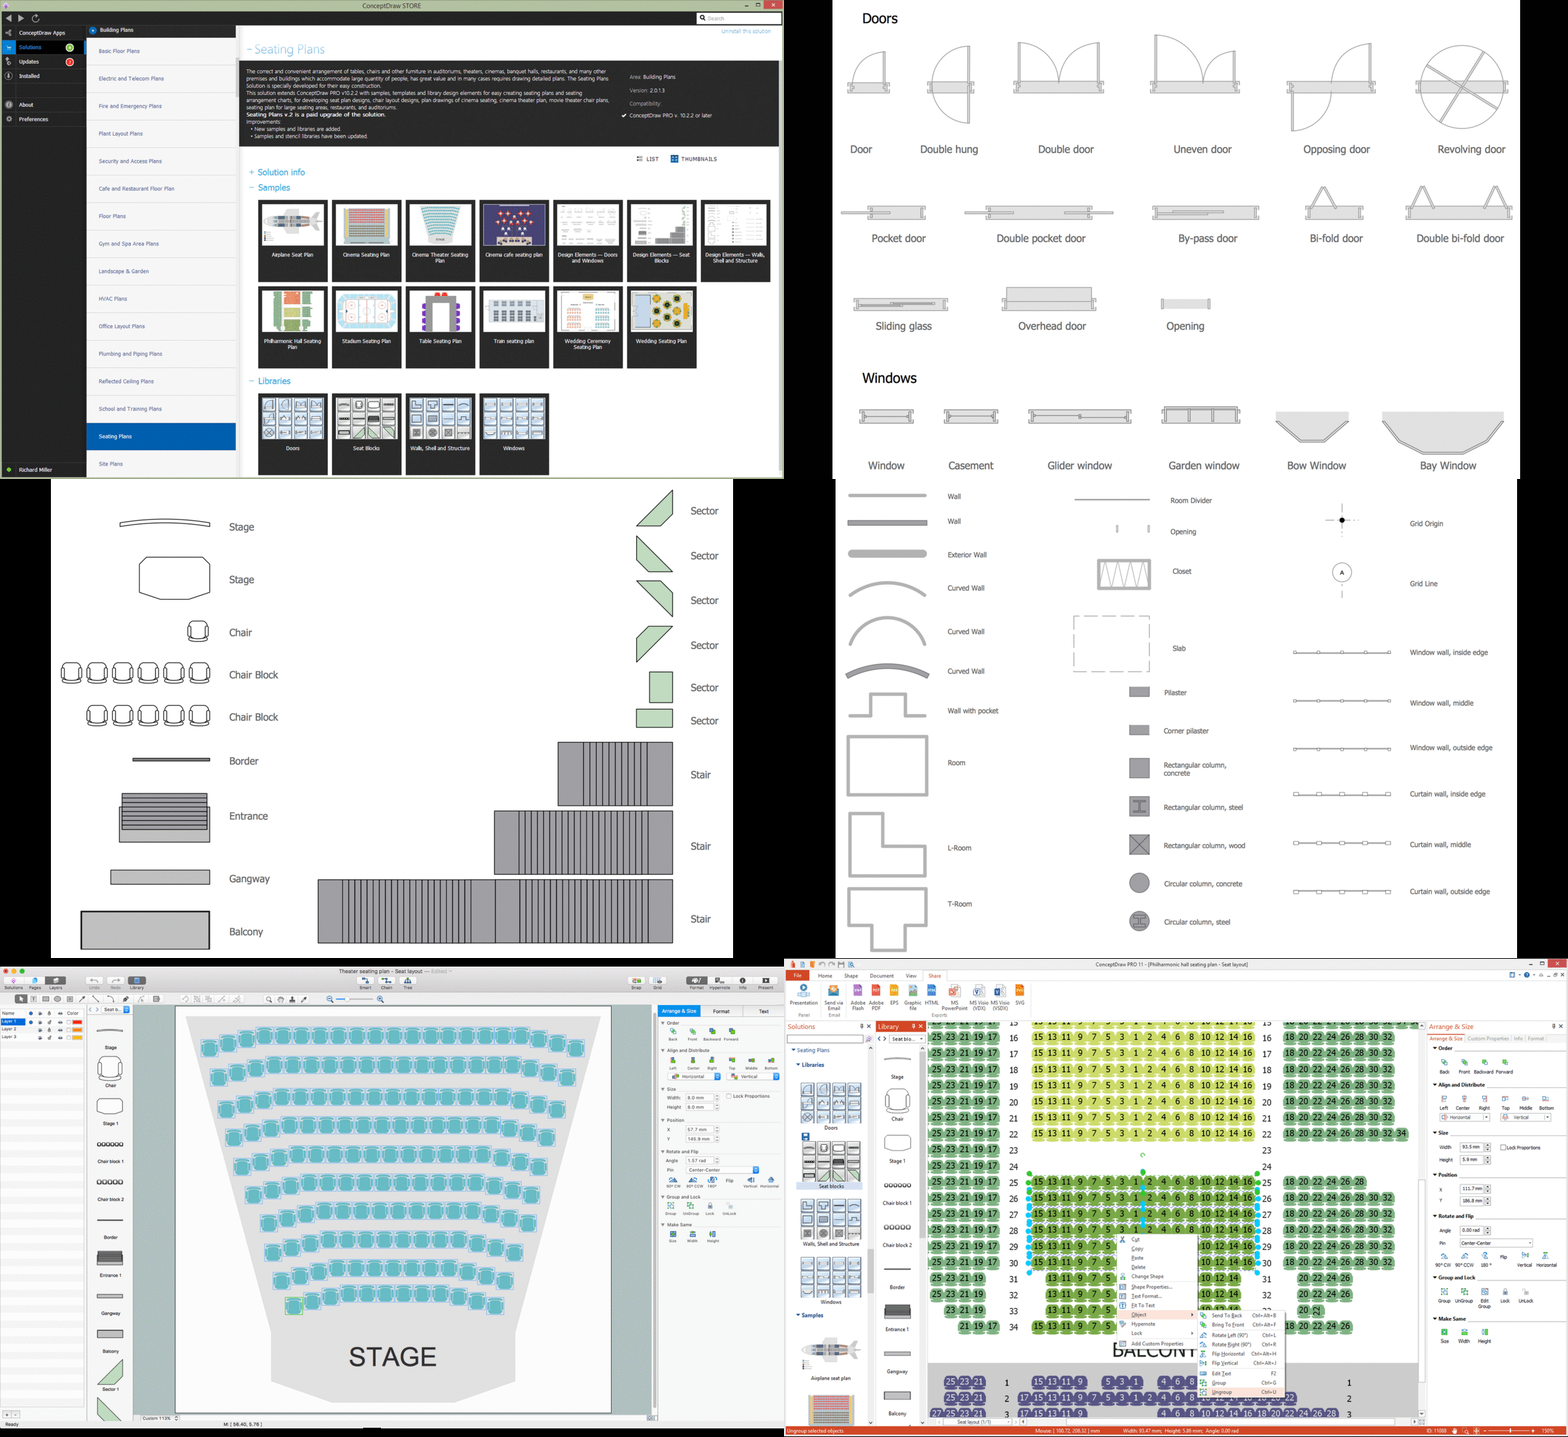
A Seating Plan is a scheme that illustrates the arrangement of seats on the plan of specific place. The seats can be located separately or grouped in rows like in stadiums. Usually they are numerated allowing spectators to choose them beforehand and have a guaranteed seat. It is especially useful for cinemas and theaters, where the places differ according to their price range. When all seatings are equal, it is used the open seating scheme and each client can choose any free seat. Each of these seating systems has many own advantages, it is also possible to mix them. Seating Plans, Schemes and Drawings are popular and widely used for purchase and sale the entering tickets to theatres, cinemas, stadiums, trains, airplanes, etc. They are also useful for beforehand planning and assignment the seats on weddings, banquets, and other events. ConceptDraw DIAGRAM enhanced with Seating Plans solution offers the helpful building drawing software tools for design Seating Plan using the predesigned templates and vector elements of doors, windows, walls, seats, etc.
Personal area (PAN) networks. Computer and Network Examples
Personal area network (PAN) is a network organized on a limited area and used for data transmission between various personal devices, such as computers, tablets, laptops, telephones, different digital and mobile devices, etc. and also for connecting to higher level network and Internet. PAN is used to manage the interconnections of IT devices which surround a single user and generally contains such appliances, as cordless mice, keyboard, phone, and Bluetooth handsets. PANs can be wired with computer buses, or wirelessly connected to the Internet using such network technologies as Bluetooth, Z-Wave, ZigBee, IrDa, UWB, Body Area Network. PANs have a lot of pros and cons, they are expedient, lucrative and handy, but sometimes have bad connection with other networks on the same radio bands, Bluetooth has distance limits and slow data transfer speed, but is comparatively safe. ConceptDraw DIAGRAM diagramming software supplied with numerous solutions of Computer and Networks Area included to ConceptDraw Solution Park perfectly suits for designing the Personal Area Networks.
ERD Symbols and Meanings
Entity Relationship Diagram (ERD) is a popular software engineering tool for database modeling and illustration the logical structure of databases, which uses one of two notations - Chen's or Crow’s Foot. Crow's foot notation is effective when used in software engineering, information engineering, structured systems analysis and design. Each of these notations applies its own set of ERD symbols. Crow's foot diagrams use boxes to represent entities and lines between these boxes to show relationships. Varied shapes at the ends of lines depict the cardinality of a given relationship. Chen's ERD notation is more detailed way to represent entities and relationships. ConceptDraw DIAGRAM application enhanced with all-inclusive Entity-Relationship Diagram (ERD) solution allows design professional ER diagrams with Chen's or Crow’s Foot notation on your choice. It contains the full set of ready-to-use standardized ERD symbols and meanings helpful for quickly drawing, collection of predesigned ERD samples, examples and templates. ConceptDraw Pro is a great alternative to Visio for Mac users as it offers more features and can easily handle the most demanding professional needs.
Campus Area Networks (CAN). Computer and Network Examples
Campus Area Network (CAN) is a computer network which provides wireless access to the Internet or LAN for the users located in two or more buildings on the limited geographical area, or in the open space surrounding these buildings. Campus Area Network is usually set in campus of a university or college, but the same kind of planning and design can be applied for other purposes, for enterprises, office buildings, military bases, industrial complexes, public places like supermarkets, entertainment centers, etc. Another form of temporary CAN can exist during some special events such as rallies, music festivals. The elementary Campus Area Network can also arise spontaneously, due to the distance of spread the radio signals from the access points that are not limited by buildings walls. It is also sensible to have additional access points for the larger and more complex CANs, located at specially places chosen for serving clients. Design easy diagrams and schemes for the Campus Area Networks with Computer Network Diagrams solution for ConceptDraw DIAGRAM.
SWOT Analysis
The success of the company depends on how successfully it is able to react on different outside influences. When analyzing the external situation, it is necessary to identify the factors most significant on a specified period of time. An interrelated consideration of these factors with the company's possibilities allows to solve effectively appearing problems. One of the most common methods of assessment together internal and external factors influencing the company's development is a SWOT analysis. SWOT analysis (acronym composed of the first letters of the words: strength, weakness, opportunities, threats) is one of the most common and effective types of analysis in marketing and marketing researches. It allows to identify and structure the strengths and weaknesses of an enterprise, as well as potential opportunities and threats of the market, to make conclusion in which direction a given organization needs to develop its business and to formulate the organization's strategy. Use the ConceptDraw MINDMAP software and offered SWOT analysis templates for easy holding SWOT analysis for your company. This Mind Map displays the SWOT analysis for a company and variety of performance measures that influence its work.SWOT Matrix Software
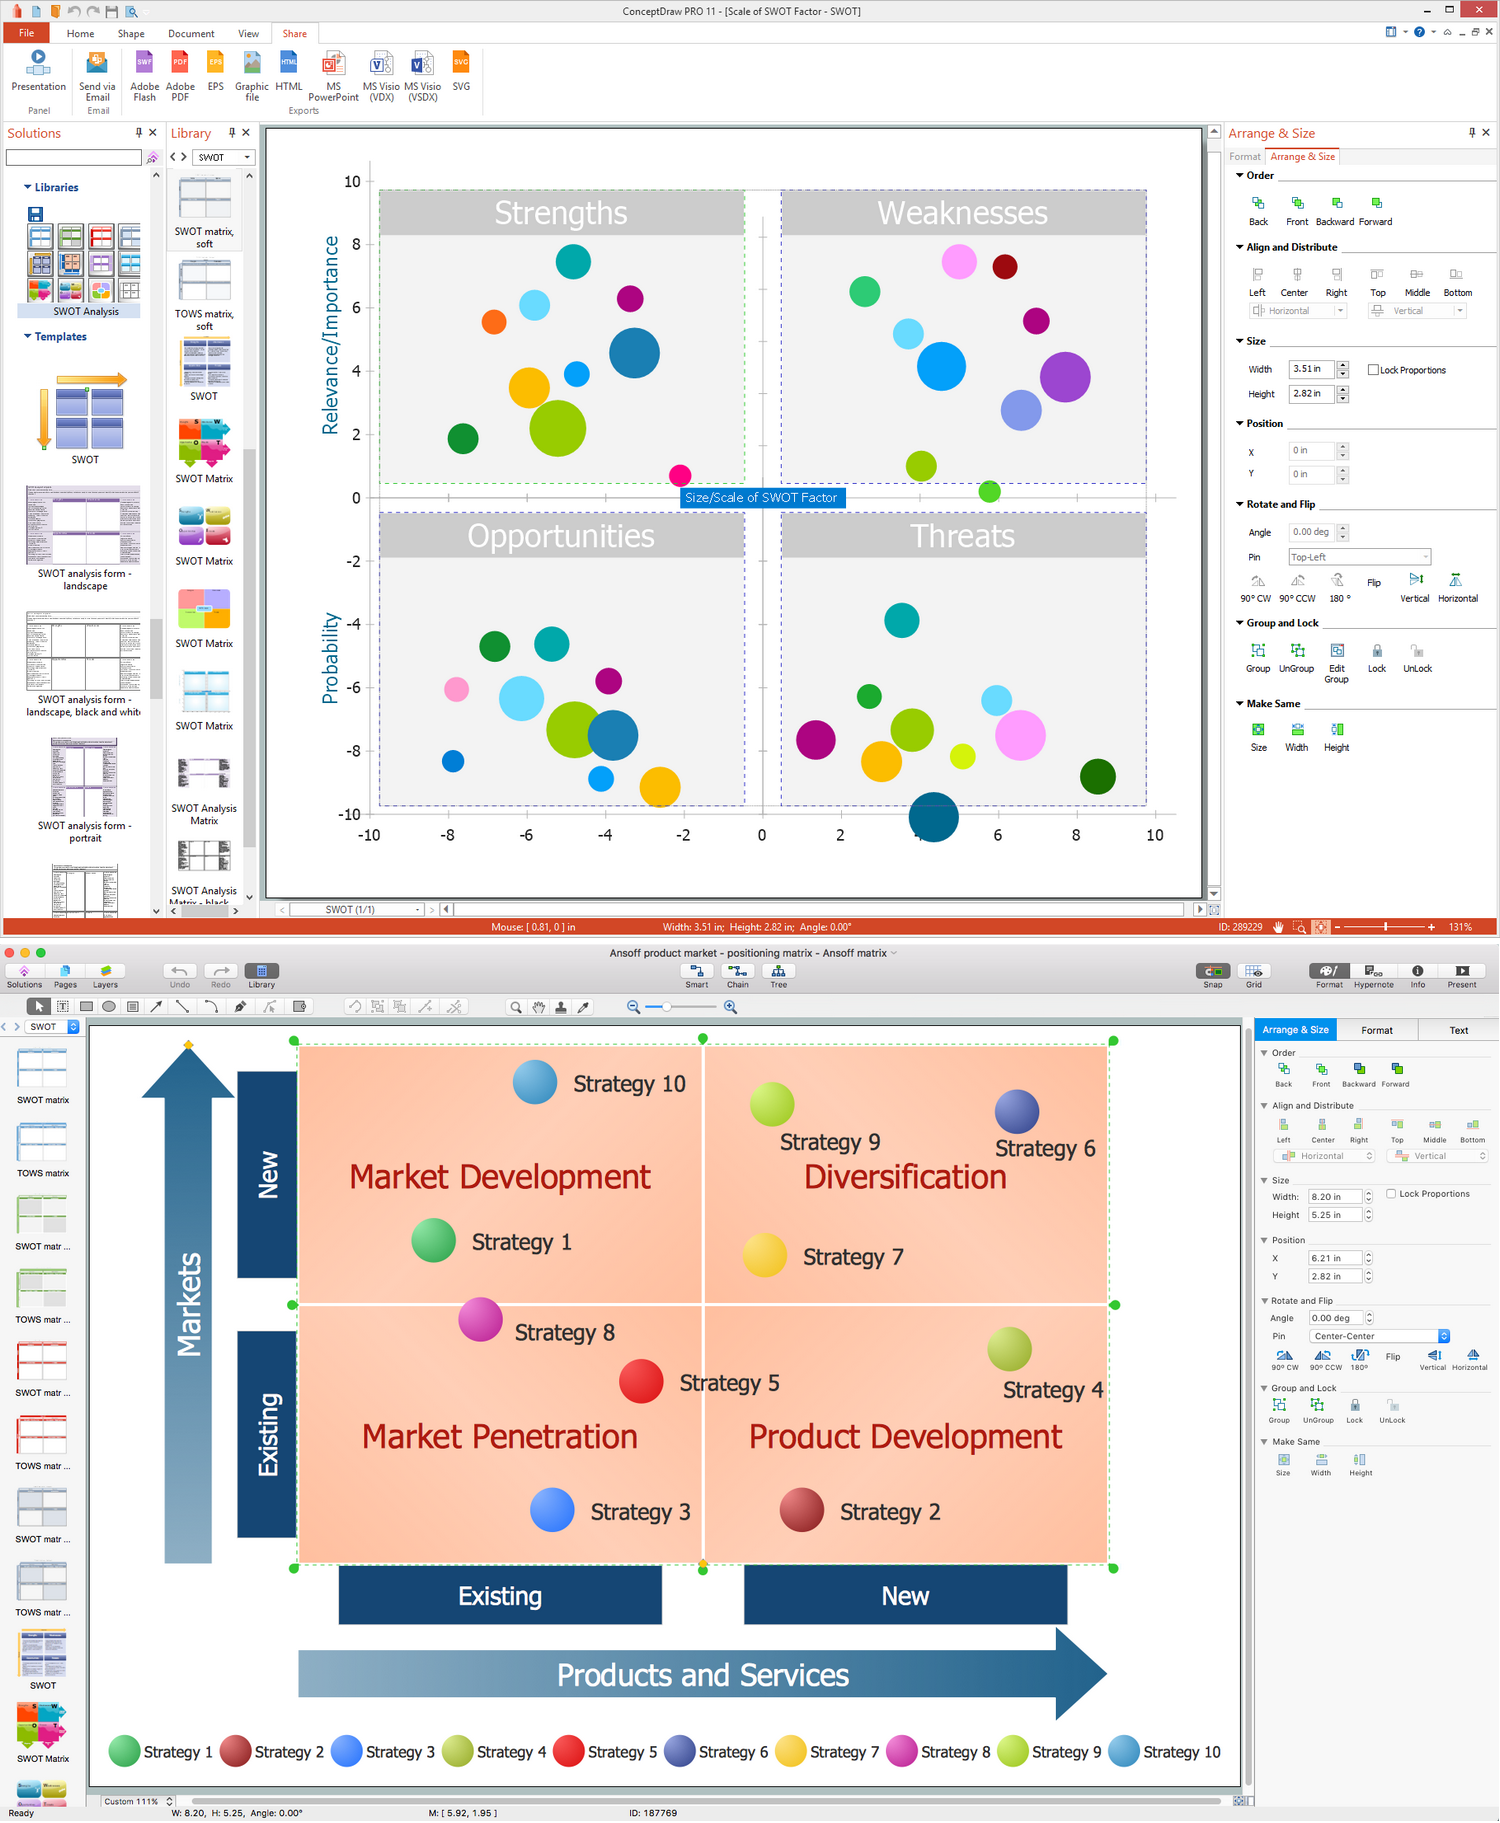
The SWOT Analysis solution from the Management area of ConceptDraw Solution Park contains set of examples, templates and vector design elements of SWOT and TOWS matrices. It helps you to quickly draw SWOT and TOWS analysis matrix diagrams using the best SWOT matrix software ConceptDraw DIAGRAM.Star Network Topology
Star is a basic computer network topology in which all nodes (computers and peripheral devices) of the network are connected to the central hub or switch with a point-to-point connection, forming a physical network segment. Such network segment can function separately or as a part of complex network topology. The switch is a server, the peripherals are the clients. The large workload and functions of network management are entrusted on the central computer, all information exchange goes through it, so it must to be obligatory the most powerful. The star network topology is a simple topology for design and implementation. Its advantages are high performance, flexible administration capabilities, simplicity of adding additional nodes and search of faults, the fact that a failure of one workstation doesn't affect the work of entire network. But the failure of central hub will result the failure of whole network or network segment - it's the main disadvantage. Use the ConceptDraw DIAGRAM with Computer and Networks solution to designing Star Network Topology Diagrams fast and easy.
Prioritization Matrix
You can design the Prioritization Matrix by hand on the paper, but we offer you the most easier way - to use the ConceptDraw DIAGRAM diagramming and vector drawing software extended with Seven Management and Planning Tools Solution from the Management Area.SWOT analysis matrix diagram templates
SWOT analysis or SWOT Matrix is a structured method of the planning which is used to evaluate the S - Strengths, W - Weaknesses, O - Opportunities, and T - Threats involved in a business project or commercial venture. It was introduced at 1960s as a tool for learning the internal capabilities of large companies. A SWOT analysis includes the indication of the project's goal, specification the critical factors (internal and external) that influence on the achievement of company's business goal, that are conducive or adverse for this. SWOT analysis is effective way to successful business, to win in rivalry with competitors and become the best on your market. SWOT Analysis solution from Management area of ConceptDraw Solution Park makes the ConceptDraw DIAGRAM a powerful SWOT and TOWS analysis software. It contains a lot of vector design elements of SWOT and TOWS matrices, numerous examples and templates. The predesigned SWOT example or template is a fastest way of drawing professional-looking SWOT Matrix and presenting analysis results in just one click.- IDEF9 Standard | Structured Systems Analysis And Design Method ...
- Structured Systems Analysis and Design Method (SSADM) with ...
- Structured Systems Analysis and Design Method (SSADM) with ...
- ERD Symbols and Meanings | Software for Creating SWOT Analysis ...
- Structured Systems Analysis and Design Method (SSADM) with ...
- Advantages And Disadvantages Of Data Flow Diagram
- Ssadm Advantages And Disadvantages
- Structured Systems Analysis and Design Method (SSADM) with ...
- Disadvantage Of Fault Tree


