Total Quality Management Value

Stakeholder Management System

Quality Management System
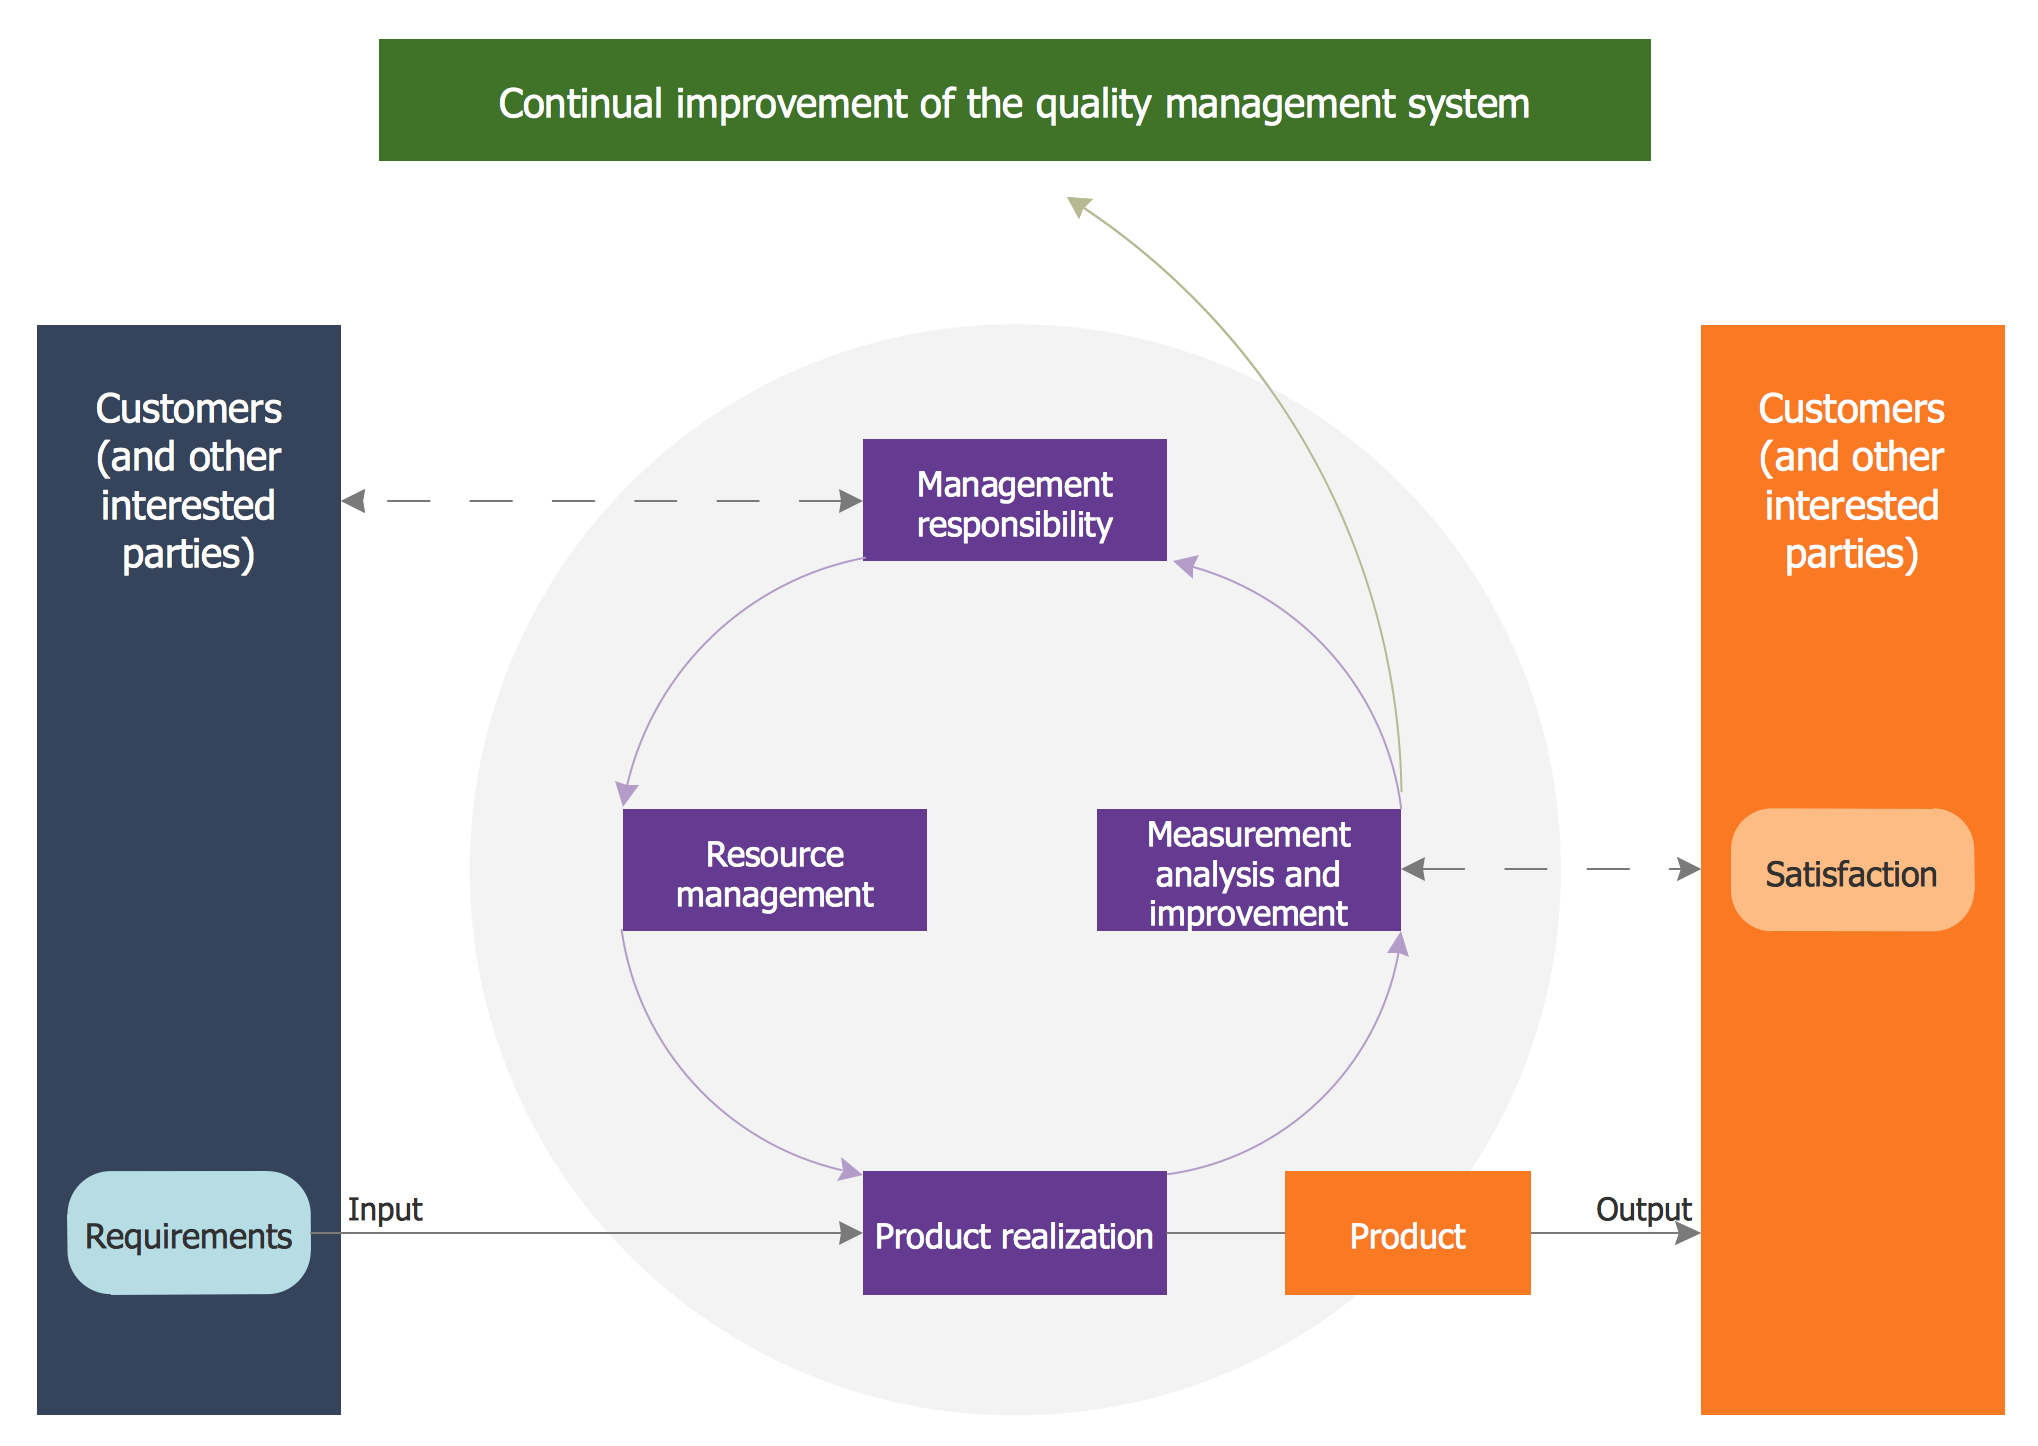
 Circle-Spoke Diagrams
Examples of subject areas that are well suited to this approach are marketing, business, products promotion, process modeling, market, resource, time, and cost analysis. Circle-Spoke Diagrams are successfully used in presentations, conferences, management documents, magazines, reportages, reviews, reports, TV, and social media.
Pyramid Diagram

HelpDesk
How to Create a VSM Diagram Using Solutions

BCG Matrix

 Entity-Relationship Diagram (ERD)
Entity-Relationship Diagram (ERD) solution extends ConceptDraw DIAGRAM software with templates, samples and libraries of vector stencils from drawing the ER-diagrams by Chen's and crow’s foot notations.
Star Network Topology


 Office Layout Plans
Office layouts and office plans are a special category of building plans and are often an obligatory requirement for precise and correct construction, design and exploitation office premises and business buildings. Designers and architects strive to make office plans and office floor plans simple and accurate, but at the same time unique, elegant, creative, and even extraordinary to easily increase the effectiveness of the work while attracting a large number of clients.
 Winter Sports
The Winter Sports solution from Sport area of ConceptDraw Solution Park contains winter sports illustration examples, templates and vector clipart libraries.
- Stakeholder Onion Diagrams
- Project Timeline | Timeline Examples | Business Processes ...
- Stakeholder Onion Diagrams
- Stakeholder Onion Diagrams | ConceptDraw Solution Park | Project ...
- Marketing | Target diagrams - Vector stencils library | Target and ...
- Target diagrams - Vector stencils library | Marketing | Target and ...
- Stakeholder Onion Diagram Template
- Example Of Affinity Diagram Business Requirements
- Target diagrams - Vector stencils library | Stakeholder Onion ...
- Stakeholder Onion Diagrams
- Diagram For Strategic Management
- Visualize Stakeholder Analysis | Stakeholder Mapping Tool ...
- Project Timeline | Timeline Examples | Timeline Diagrams | Timeline ...
- Target diagrams - Vector stencils library | Leadership and data ...
- Vector Diagram Of Strategic Management
- Software Work Flow Process in Project Management with Diagram ...
- Strategic Management Diagram
- The Diagram Of The Strategic Management Process
- Marketing | Target diagrams - Vector stencils library | Target ...
- What Is Strategic Management Diagram