Diagramming software for Amazon Web Service icon set: Networking and Content Delivery
Circular Diagram

UML Package Diagram. Design Elements

 Target and Circular Diagrams
This solution extends ConceptDraw DIAGRAM software with samples, templates and library of design elements for drawing the Target and Circular Diagrams.
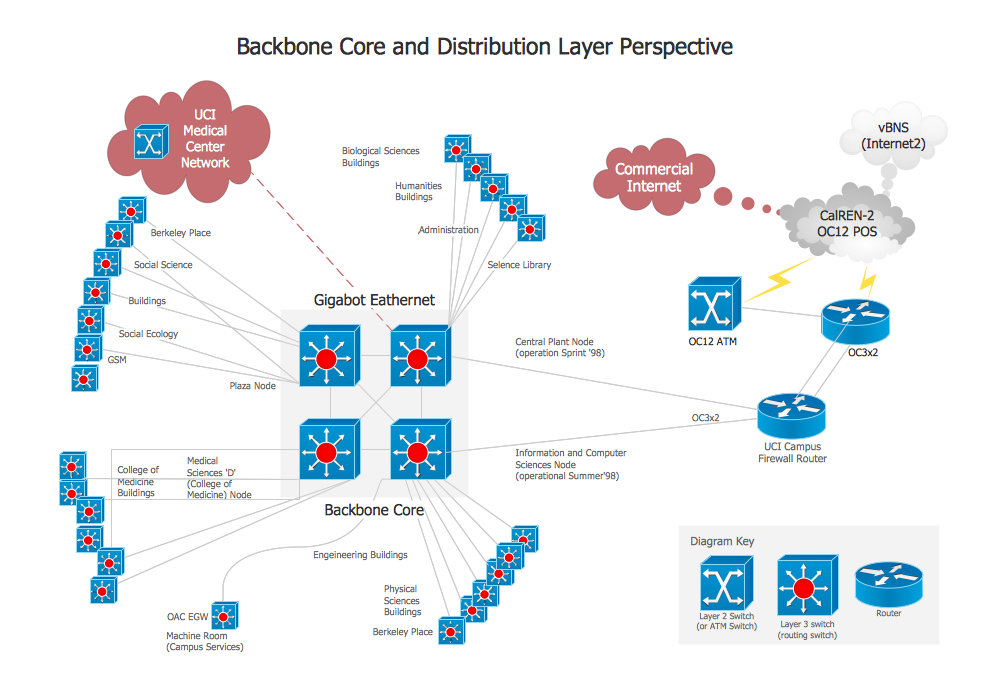
Network Diagram Software Backbone Network

Pyramid Diagram

"A document management system (DMS) is a computer system (or set of computer programs) used to track and store electronic documents. It is usually also capable of keeping track of the different versions modified by different users (history tracking). The term has some overlap with the concepts of content management systems. It is often viewed as a component of enterprise content management (ECM) systems and related to digital asset management, document imaging, workflow systems and records management systems. ...
Document management systems commonly provide storage, versioning, metadata, security, as well as indexing and retrieval capabilities." [Document management system. Wikipedia]
The block diagram example "Document management system architecture" was created using the ConceptDraw PRO diagramming and vector drawing software extended with the Block Diagrams solution from the area "What is a Diagram" of ConceptDraw Solution Park.
System architecture diagram

The vector stencils library "AWS Storage" contains 18 Amazon Web Services storage icons: Amazon EFS icons, Amazon Glacier icons, Amazon S3 icons, AWS Snowball icons, AWS Storage Gateway icons, Amazon EBS icon, snapshot icon, volume icon.
Use it to draw Amazon Web Services architecture diagrams with ConceptDraw PRO diagramming and vector drawing software.
"AWS provides a variety of services to meet your storage needs. ...
The following are the key storage services:
Amazon S3
Scalable storage in the AWS cloud.
CloudFront
A global content delivery network (CDN).
Amazon EBS
Network attached storage volumes for your virtual servers.
Amazon Glacier
Low-cost archival storage." [docs.aws.amazon.com/ gettingstarted/ latest/ awsgsg-intro/ gsg-aws-storage-cdn.html]
The AWS icons example "Design elements - AWS Storage and Content Delivery" is included in the AWS Architecture Diagrams solution from the Computer and Networks area of ConceptDraw Solution Park.
Amazon Web Services icons
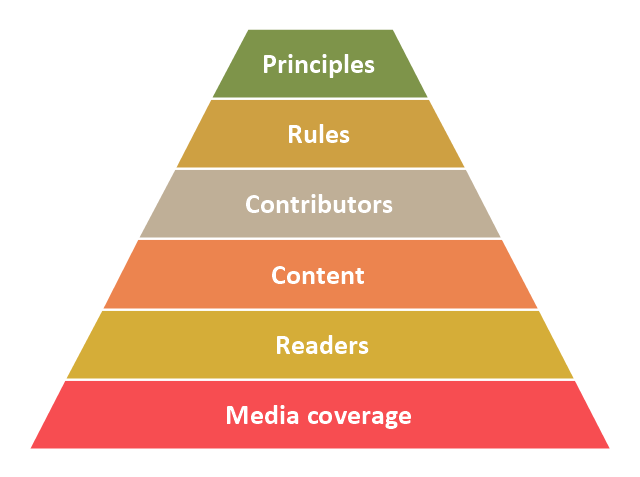
"Wikipedia's success metrics supersede each other in the following order:
1. Media coverage is the most basic metric for success – it provides notability and a public image for the project.
2. The number of readers supersedes media coverage – irrespective of the media, the number of actual readers matters more (high media coverage and low number of readers actually means the project is not successful; on the contrary, low media coverage and a high number of readers means the project is successful).
3. The quality and quantity of content is more important than the current number of readers – good content creates readership.
4. Content cannot be created without contributors, therefore the number of contributors and their ability to create meaningful content is more important than the current content.
5. Good contributors leave the project if they're not treated in a fair manner, and potential contributors are not interested in joining if they feel the project is misguided – therefore applying rules in a fair manner is more important than retaining contributors at any cost.
6. Misguided rules are guaranteed to ruin any enterprise, therefore all rules must necessarily be the result of applying healthy principles – the logic goes both ways, applying existing rules in fringe situations against the principles is disastrous." [Wikipedia's hierarchy of needs. Wikipedia]
This Wikipedia's hierarchy of priorities pyramid diagram was redesigned using the ConceptDraw PRO diagramming and vector drawing software from Wikimedia Commons file Wikipedia priority pyramid.png. [commons.wikimedia.org/ wiki/ File:Wikipedia_ priority_ pyramid.png]
This pyramid chart example is included in the Pyramid Diagrams solution from the Marketing area of ConceptDraw Solution Park.
Pyramid diagram
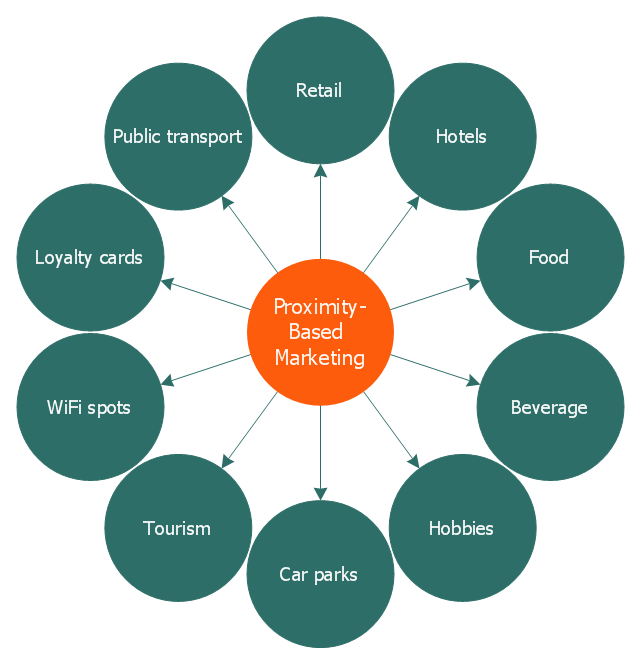
This circle-spoke diagram sample illustrates the proximity marketing.
"Proximity marketing is the localized wireless distribution of advertising content associated with a particular place. Transmissions can be received by individuals in that location who wish to receive them and have the necessary equipment to do so.
Distribution may be via a traditional localized broadcast, or more commonly is specifically targeted to devices known to be in a particular area.
The location of a device may be determined by:
(1) A cellular phone being in a particular cell.
(2) A Bluetooth or WiFi device being within range of a transmitter.
(3) An Internet enabled device with GPS enabling it to request localized content from Internet servers.
(4) A NFC enabled phone can read a RFID chip on a product or media and launch localized content from internet servers.
Communications may be further targeted to specific groups within a given location, for example content in tourist hot spots may only be distributed to devices registered outside the local area.
Communications may be both time and place specific, e.g. content at a conference venue may depend on the event in progress.
Uses of proximity marketing include distribution of media at concerts, information (weblinks on local facilities), gaming and social applications, and advertising." [Proximity marketing. Wikipedia]
The hub-and-spoke diagram example "Proximity based marketing" was created using the ConceptDraw PRO diagramming and vector drawing software extended with the Circle-Spoke Diagrams solution from the area "What is a Diagram" of ConceptDraw Solution Park.
Circle-spoke diagram
Cisco Switches and Hubs. Cisco icons, shapes, stencils and symbols

Architecture Diagrams

Swim Lane Flowchart Symbols

How to Create a Social Media DFD Flowchart

- Process Diagram For Content Management System
- Content Management Workflow Diagram
- Content Management System Architecture Diagram
- Target and Circular Diagrams | Content marketing cycle - Ring chart ...
- Target and Circular Diagrams | Content marketing cycle - Diamond ...
- Block diagram - Document management system architecture | How ...
- Content marketing cycle - Ring chart | Sales Process Flowchart ...
- Content marketing cycle - Diamond pie chart | Recycle Diagram
- ConceptDraw PRO ER Diagram Tool | Bio Flowchart Lite | Content ...
- Process Flowchart | Content Marketing Infographics | Photo For E ...
- Block Diagram Of Content Management System
- Content Delivery Network Diagram
- ConceptDraw PRO ER Diagram Tool | Content Marketing ...
- Bio Flowchart Lite | Content Marketing Infographics | ConceptDraw ...
- Block diagram - Document management system architecture | Block ...
- National Preparedness Cycle - Arrow ring chart | Content marketing ...
- Content Management Flowchart
- Content marketing cycle - Diamond pie chart | How to Draw a Pie ...
- Marketing Plan Infographic | Marketing Analysis Diagram | Flowchart ...
- Design elements - AWS Storage and Content Delivery ...