Pyramid Diagram and Pyramid Chart
Pyramid Diagram, Triangle Chart or Triangular Diagram is a convenient and useful type of diagrams, which lets represent the data hierarchical structure and to illustrate the foundation-based relationships between the hierarchy levels. Pyramid Diagrams are used to visualize effectively the hierarchical, as well as proportional and foundation-based relationships, the process steps, the interconnections of organizational layers or topics. ConceptDraw DIAGRAM software enhanced with Pyramid Diagrams solution from Marketing area of ConceptDraw Solution Park is a powerful business charting software, that includes all required tools for designing the multilevel Pyramid Diagrams as quickly as possible. The build-in vector stencils and templates are the great aid for designers, a variety of examples and samples is a good base and source of inspiration. Use attractive and vivid 2D and 3D Pyramid Diagrams and Triangle Charts designed in ConceptDraw DIAGRAM to illustrate your documents, presentations, infographics, articles, reports, websites, etc.Value stream with ConceptDraw DIAGRAM
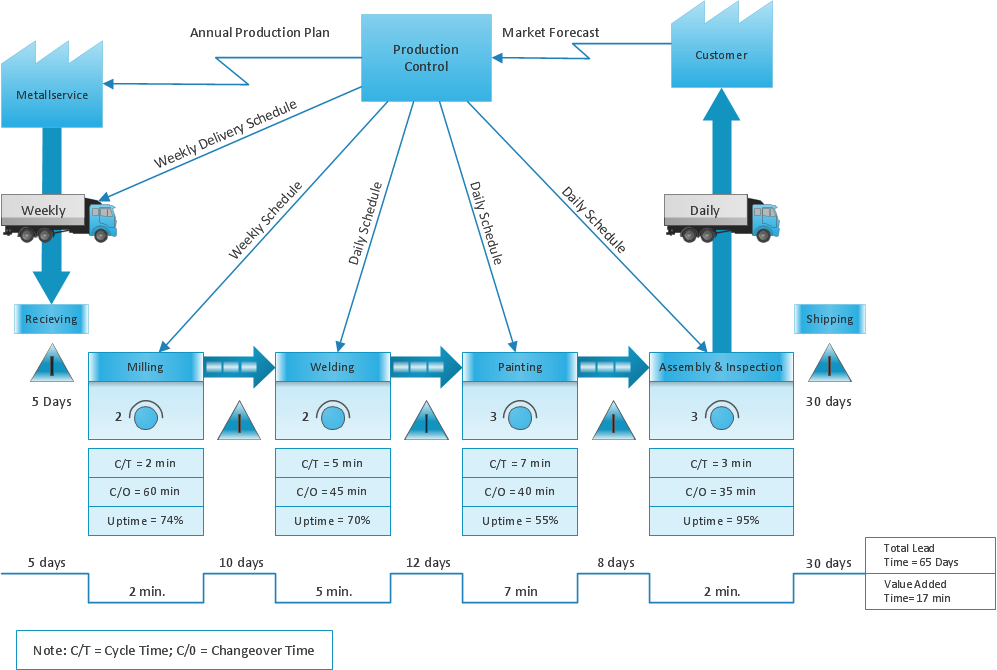
The Value stream is a totality of all actions on the projection, order composition and production: starting from creation a product project to launching this product, from order to delivery, from extraction of raw materials to ready product manufacturing. Value stream mapping is a process of visualization of these actions and creation of a detailed and graphical map.Learn how to create a current state value stream map
Value Stream Mapping solution extends ConceptDraw DIAGRAM software with templates, samples and vector shapes for drawing the current state value stream maps.Value Stream & Process Flow Diagramming Software
Value Stream & Process Flow Diagramming Software is a very popular Lean Manufacturing tool that allows to see and visualize in details the company's processes and current state, the flow of material and information, and thus gives the possibility to analyze the efficiency of company's processes and then develop improved processes. Value stream maps are also a good way to define the steps that do not add value to the end product, in other words waste in a company's processes.The Lean Enterprise Value Stream Mapping
Create value stream maps - for value stream analysis and value stream management, material and information flow mapping, using our quick start templates included with ConceptDraw.Value Stream Mapping - Design Elements
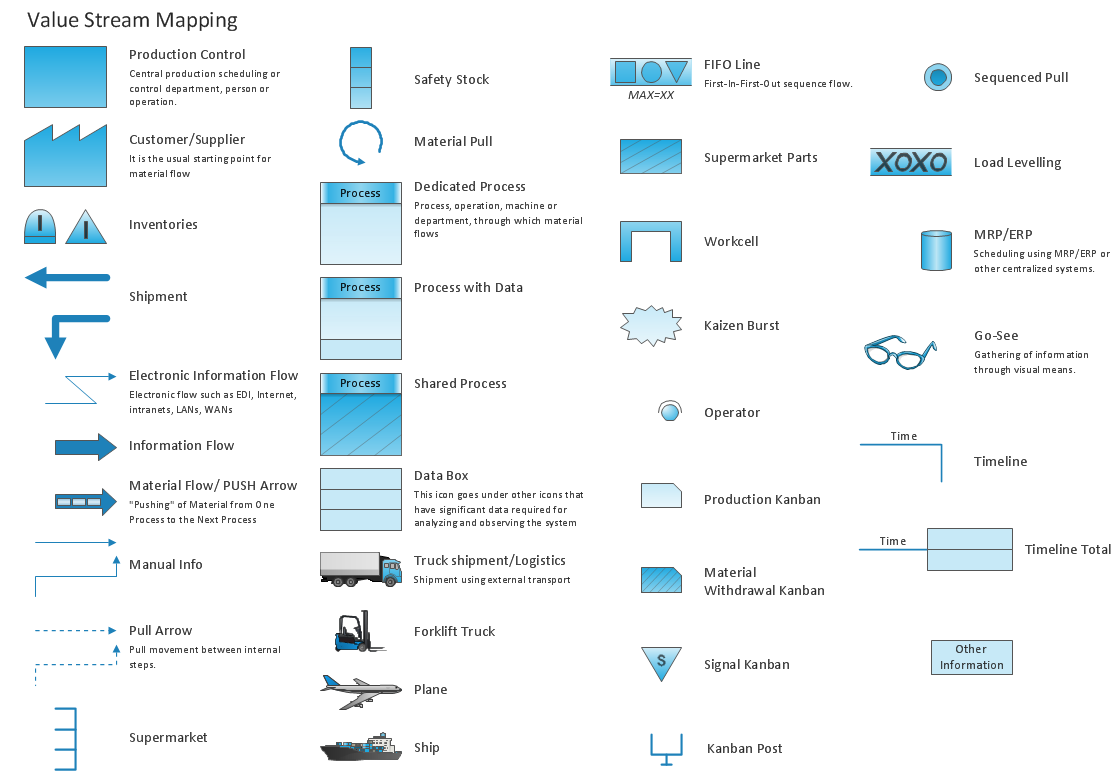
ConceptDraw DIAGRAM is a software for making Value Stream Mapping diagram with more than 10 library objects that are scalable vector images.Value Stream Mapping Software
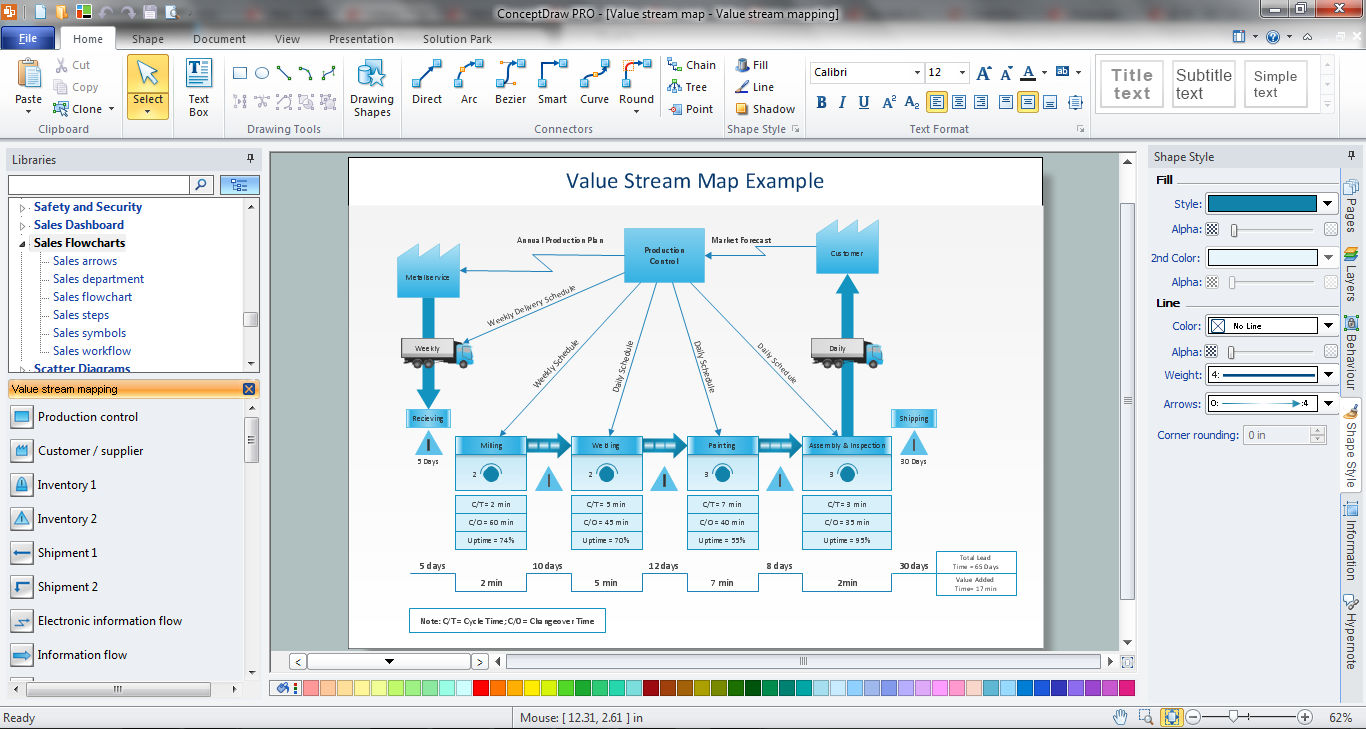
ConceptDraw DIAGRAM is a best Value Stream Mapping software. The graphical representation of a process is a powerful tool that helps in the diagnosis of process efficiency and allows companies to develop improved processes. The new Value Stream Mapping solution found in the ConceptDraw Solution Park continues to extend the range of ConceptDraw DIAGRAM into a business graphics tool that can be used to document processes in any organization.Porter's Value Chain
ConceptDraw DIAGRAM diagramming and vector drawing software offers you the Matrices Solution from the Marketing Area with extensive drawing tools for creating the Porter's Value Chain diagrams.Best Value Stream Mapping mac Software
Create value stream maps - for value stream analysis and value stream management, material and information flow mapping, using our quick start templates included with ConceptDraw.Lean Six Sigma Diagram Software
Lean Six Sigma (LSS) is a well-known in all over the world methodology of quality improvement and business perfection. ConceptDraw DIAGRAM diagramming and vector drawing software is a powerful Lean Six Sigma Diagram Software thanks to the included Value Stream Mapping solution from the Quality Management Area of ConceptDraw Solution Park.- Service Delivery Process Flow Chart
- Food Delivery Process Flow Chart
- A Diagram To Explain The Correct Administration Process For
- Logistics Flow Charts | Process Flowchart | Flow chart Example ...
- Basic Diagramming | Process Flow Chart Symbol | Data Flow ...
- Diagram To Explain The Administration Process To Purchase A ...
- Business Process Mapping | Market value - Pyramid diagram ...
- Flow chart Example. Warehouse Flowchart | Value Stream Mapping ...
- Delivery Process Flow Visio
- Business Processes | Flow chart Example. Warehouse Flowchart ...


