"Consumption of energy resources, (e.g. turning on a light) requires resources and has an effect on the environment. Many electric power plants burn coal, oil or natural gas in order to generate electricity for energy needs. While burning these fossil fuels produces a readily available and instantaneous supply of electricity, it also generates air pollutants including carbon dioxide (CO2), sulfur dioxide and trioxide (SOx) and nitrogen oxides (NOx). Carbon dioxide is an important greenhouse gas which is thought to be responsible for some fraction of the rapid increase in global warming seen especially in the temperature records in the 20th century, as compared with tens of thousands of years worth of temperature records which can be read from ice cores taken in Arctic regions. Burning fossil fuels for electricity generation also releases trace metals such as beryllium, cadmium, chromium, copper, manganese, mercury, nickel, and silver into the environment, which also act as pollutants.
The large-scale use of renewable energy technologies would "greatly mitigate or eliminate a wide range of environmental and human health impacts of energy use". Renewable energy technologies include biofuels, solar heating and cooling, hydroelectric power, solar power, and wind power. Energy conservation and the efficient use of energy would also help." [Energy industry. Environmental impact. Wikipedia]
The Energy resources diagram example was created in the ConceptDraw PRO diagramming and vector drawing software using the Manufacturing and Maintenance solution from the Illustration area of ConceptDraw Solution Park.
Infographics

 Pie Charts
Pie Charts are extensively used in statistics and business for explaining data and work results, in mass media for comparison (i.e. to visualize the percentage for the parts of one total), and in many other fields. The Pie Charts solution for ConceptDraw DIAGRAM offers powerful drawing tools, varied templates, samples, and a library of vector stencils for simple construction and design of Pie Charts, Donut Chart, and Pie Graph Worksheets.
 Manufacturing and Maintenance
Manufacturing and maintenance solution extends ConceptDraw DIAGRAM software with illustration samples, templates and vector stencils libraries with clip art of packaging systems, industrial vehicles, tools, resources and energy.
 Divided Bar Diagrams
The Divided Bar Diagrams Solution extends the capabilities of ConceptDraw DIAGRAM with templates, samples, and a library of vector stencils for drawing high impact and professional Divided Bar Diagrams and Graphs, Bar Diagram Math, and Stacked Graph.
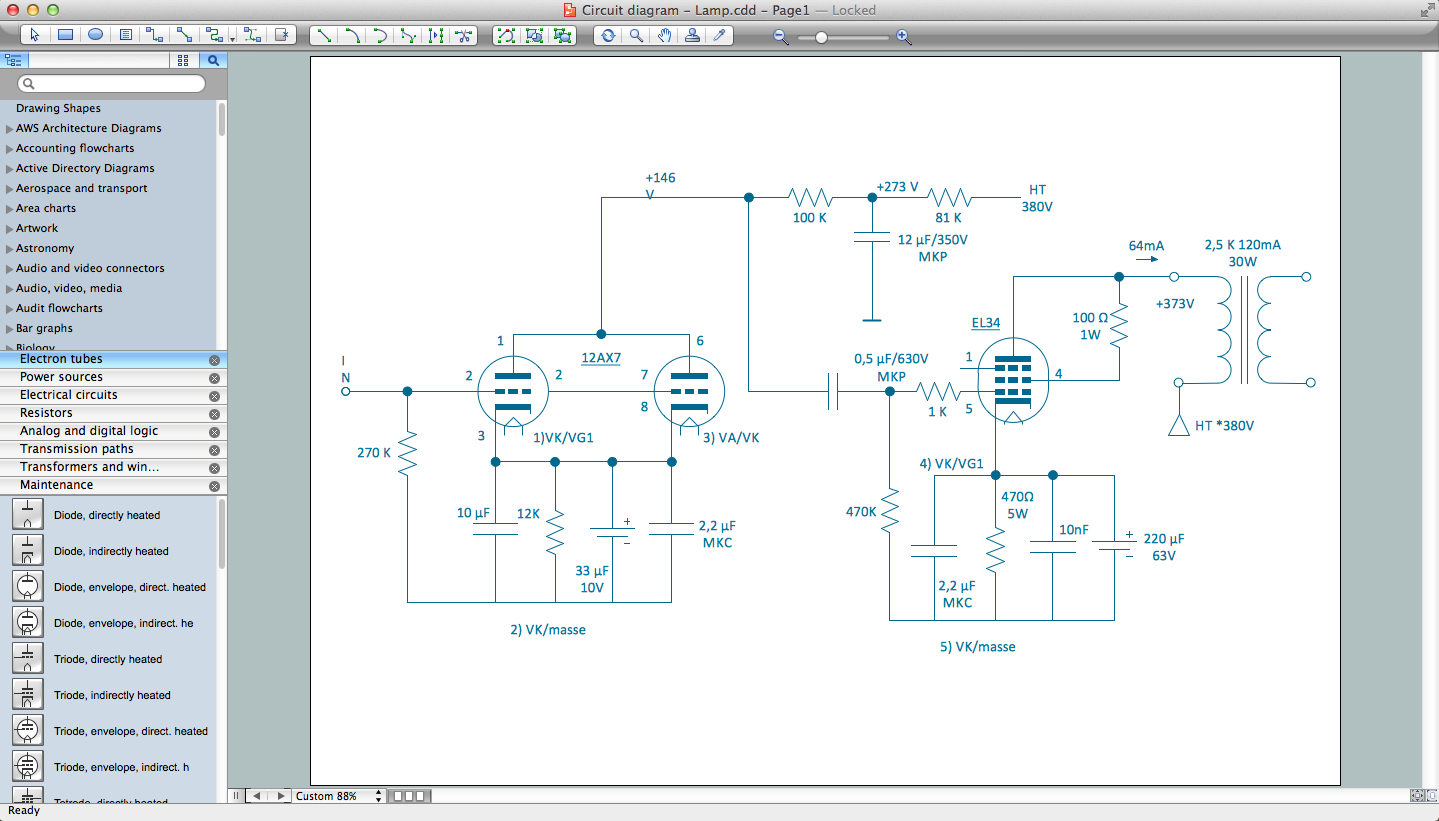
Electrical Drawing Software and Electrical Symbols
Human Resource Development

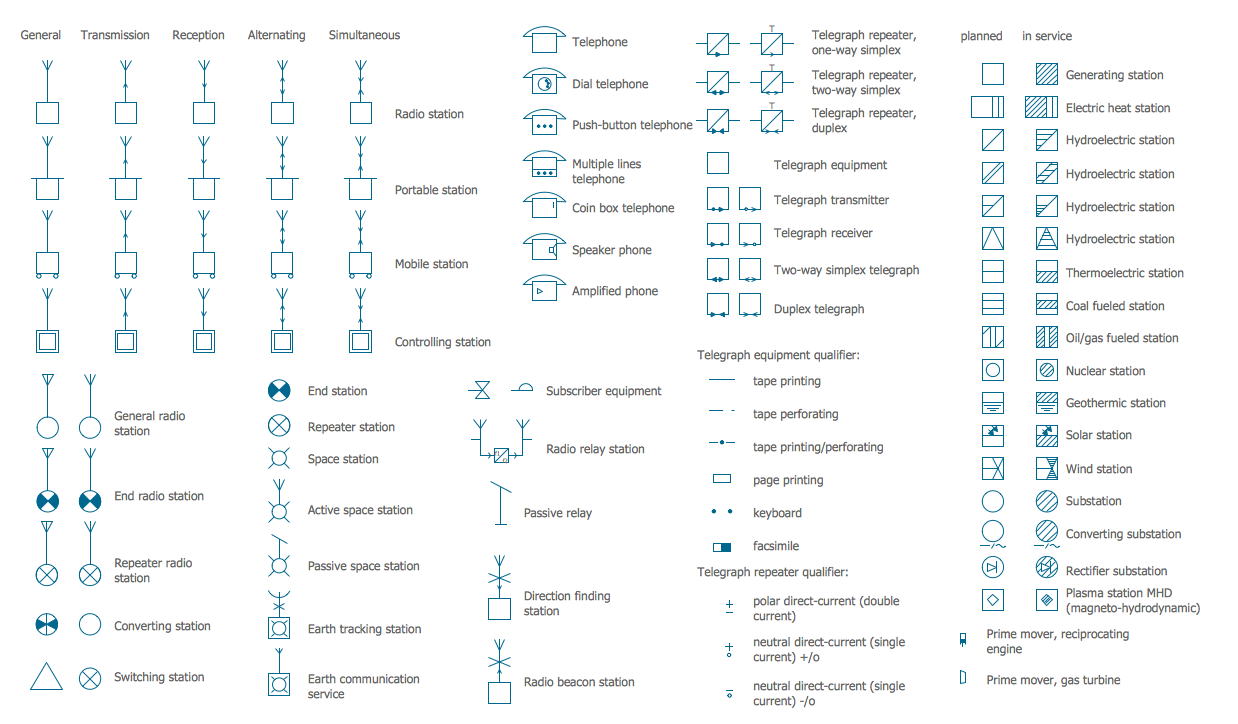
Electrical Symbols — Stations
Technical Flow Chart

Matrix Organization Structure

Organizational Structure Types

Marketing and Sales Organization chart. Organization chart Example

Matrix Organization

Functional Organizational Structure
- EU countries map - Renewable electricity generation | Energy ...
- Resources and energy - Vector stencils library | Energy resources ...
- Renewable Energy Resources Diagrams
- Energy Pyramid Diagram | Resources and energy - Vector stencils ...
- Energy resources diagram | Human Resource Development | Pie ...
- Renewable Energy Sources Drawing Charts On It
- Energy resources diagram | Drawings Of Conservation Of ...
- Renewable energy | Pie Charts | Divided Bar Diagrams | Example Of ...
- Energy resources diagram | Manufacturing and Maintenance | Pie ...
- Renewable Energy Cycle Diagram
- Vector Map of Germany | Manufacturing and Maintenance | Energy ...
- Pie Charts | Energy resources diagram | Manufacturing and ...
- Diagram Of Renewable Solar Energy Sources
- Examples Of Non Renewable Energy
- Energy resources diagram | Pie Charts | Divided Bar Diagrams ...
- Energy resources diagram | Manufacturing and Maintenance ...
- Manufacturing and Maintenance | Energy resources diagram | Pie ...
- Energy resources diagram | Energy Pyramid Diagram | Pie Charts ...
- Non Renewable Energy Sources Drawing
- Diagram Of Renewable And Non Renewable Energy