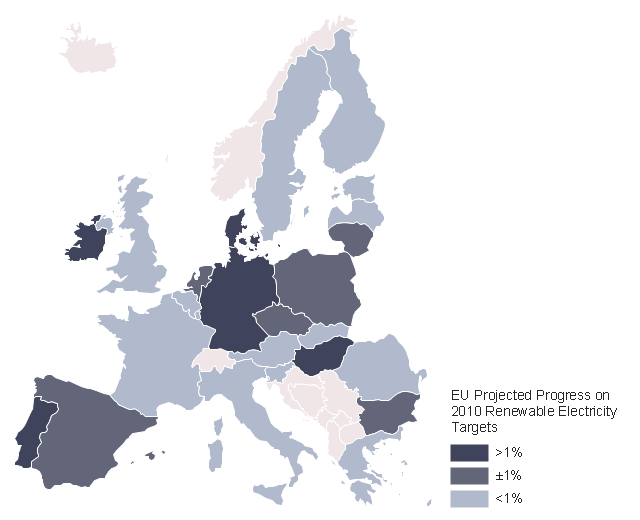
This example was created on the base of thematic map "2009 EU Renewable Electricity Share" from the article "European Union countries reach for higher renewable electricity generation" on the website of U.S. Energy Information Administration (EIA).
"Renewable generation includes hydropower, biomass, wind, solar, and geothermal. Nuclear power is not included." [www.eia.gov/ todayinenergy/ detail.cfm?id=2530]
"The countries of the European Union are the number two global leaders in the development and application of renewable energy. Promoting the use of renewable energy sources is important both to the reduction of the EU's dependence on foreign energy imports, and in meeting targets to combat global warming." [Renewable energy in the European Union. Wikipedia]
The thematic map example "EU countries map - Renewable electricity generation" was designed using the ConceptDraw PRO software extended with the Map of Germany solution from the Maps area of ConceptDraw Solution Park.
EU thematic map example
 Pie Charts
Pie Charts are extensively used in statistics and business for explaining data and work results, in mass media for comparison (i.e. to visualize the percentage for the parts of one total), and in many other fields. The Pie Charts solution for ConceptDraw PRO v10 offers powerful drawing tools, varied templates, samples, and a library of vector stencils for simple construction and design of Pie Charts, Donut Chart, and Pie Graph Worksheets.
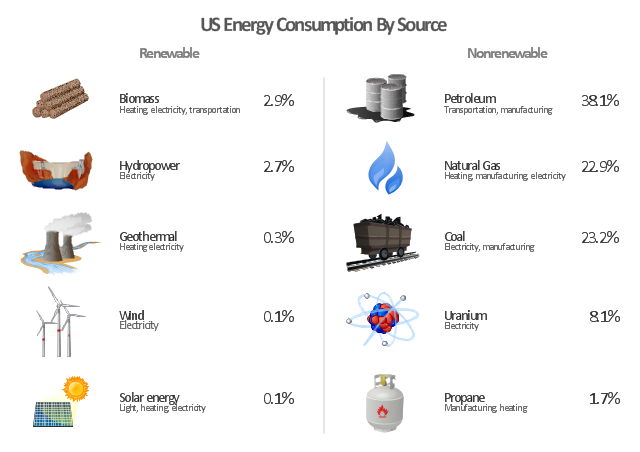
"The United States is the 800th largest energy consumer in terms of total use in 2010. ...
The majority of this energy is derived from fossil fuels: in 2010, data showed 25% of the nation's energy came from petroleum, 22% from coal, and 22% from natural gas. Nuclear power supplied 8.4% and renewable energy supplied 8%, which was mainly from hydroelectric dams although other renewables are included such as wind power, geothermal and solar energy." [Energy in the United States. Wikipedia]
The infographics example "U.S. energy consumption by source" was created in the ConceptDraw PRO diagramming and vector drawing software using the Manufacturing and Maintenance solution from the Illustration area of ConceptDraw Solution Park.
Infographics
 Divided Bar Diagrams
The Divided Bar Diagrams Solution extends the capabilities of ConceptDraw PRO v10 with templates, samples, and a library of vector stencils for drawing high impact and professional Divided Bar Diagrams and Graphs, Bar Diagram Math, and Stacked Graph.
 Manufacturing and Maintenance
Manufacturing and maintenance solution extends ConceptDraw PRO software with illustration samples, templates and vector stencils libraries with clip art of packaging systems, industrial vehicles, tools, resources and energy.
"Consumption of energy resources, (e.g. turning on a light) requires resources and has an effect on the environment. Many electric power plants burn coal, oil or natural gas in order to generate electricity for energy needs. While burning these fossil fuels produces a readily available and instantaneous supply of electricity, it also generates air pollutants including carbon dioxide (CO2), sulfur dioxide and trioxide (SOx) and nitrogen oxides (NOx). Carbon dioxide is an important greenhouse gas which is thought to be responsible for some fraction of the rapid increase in global warming seen especially in the temperature records in the 20th century, as compared with tens of thousands of years worth of temperature records which can be read from ice cores taken in Arctic regions. Burning fossil fuels for electricity generation also releases trace metals such as beryllium, cadmium, chromium, copper, manganese, mercury, nickel, and silver into the environment, which also act as pollutants.
The large-scale use of renewable energy technologies would "greatly mitigate or eliminate a wide range of environmental and human health impacts of energy use". Renewable energy technologies include biofuels, solar heating and cooling, hydroelectric power, solar power, and wind power. Energy conservation and the efficient use of energy would also help." [Energy industry. Environmental impact. Wikipedia]
The Energy resources diagram example was created in the ConceptDraw PRO diagramming and vector drawing software using the Manufacturing and Maintenance solution from the Illustration area of ConceptDraw Solution Park.
Infographics

- Example Of Renewable Resources And Nonrenewable Resources
- Renewable Resources Drawing
- Examples Of Renewable Energy Sources
- What Are Non Renewable Resources Examples
- Diagram Of Renewable Solar Energy Sources
- Draw Diagram To Show The Conservation Of Two Non Renewable ...
- Maintenance Of Non Renewable Fossil Fuel Resources
- Explain Alternative Energy Source With Suitable Flow Chart
- Examples Of Non Renewable Energy