Venn Diagram Examples for Problem Solving. Computer Science. Chomsky Hierarchy

Pyramid Diagram

Pyramid Diagram

Pyramid Diagram

Venn Diagram Maker

Flowchart Example: Flow Chart of Marketing Analysis

Pyramid Diagram

Diagram of a Pyramid

Pyramid Diagram

Hierarchical Network Topology

Program Structure Diagram

Data Flow Diagram Process

HelpDesk
How to Draw a Pyramid Diagram

Pyramid Diagram

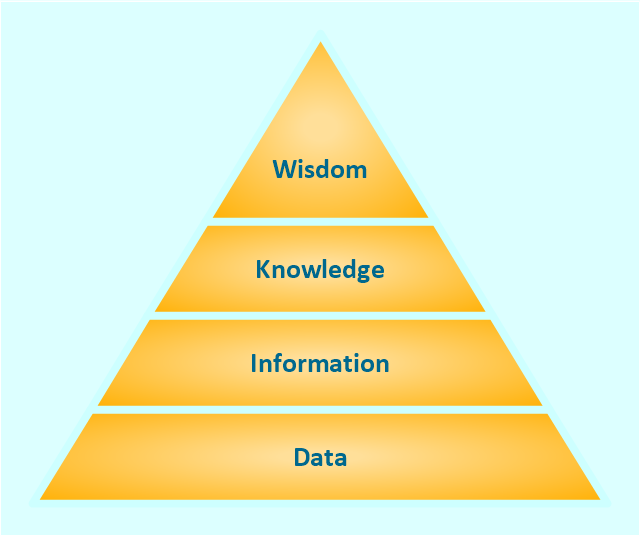
"The DIKW Pyramid, also known variously as the "DIKW Hierarchy", "Wisdom Hierarchy", the "Knowledge Hierarchy", the "Information Hierarchy", and the "Knowledge Pyramid", refers loosely to a class of models for representing purported structural and/ or functional relationships between data, information, knowledge, and wisdom. "Typically information is defined in terms of data, knowledge in terms of information, and wisdom in terms of knowledge"."
[DIKW Pyramid. Wikipedia]
This triangle diagram example of DIKW pyramid has 4 levels: data, information, knowledge and wisdom.
It redesigned using the ConceptDraw PRO diagramming and vector drawing software from Wikimedia Commons file DIKW-diagram.png. [commons.wikimedia.org/ wiki/ File:DIKW-diagram.png]
This file is licensed under the Creative Commons Attribution-Share Alike 3.0 Unported license. [creativecommons.org/ licenses/ by-sa/ 3.0/ deed.en]
The trianglular chart sample "Knowledge hierarchy triangle diagram" is included in the Pyramid Diagrams solution from the Marketing area of ConceptDraw Solution Park.
Pyramid diagram
Customizable Six Markets Model Chart Template

Pyramid Diagram

Control and Information Architecture Diagrams (CIAD) with ConceptDraw DIAGRAM
<br> with ConceptDraw DIAGRAM *")
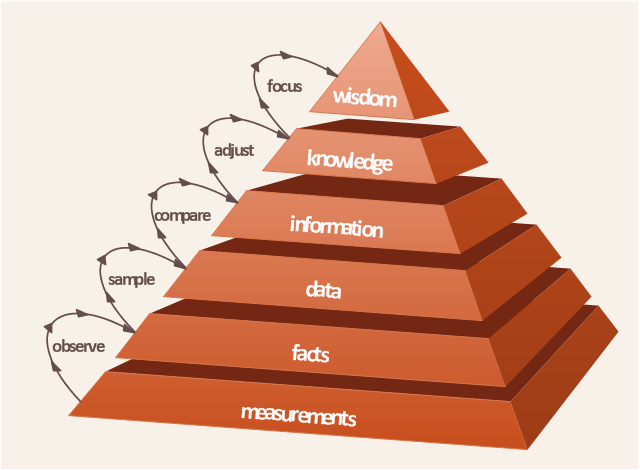
The DIKW Pyramid, also known variously as the "DIKW Hierarchy", "Wisdom Hierarchy", the "Knowledge Hierarchy", the "Information Hierarchy", and the "Knowledge Pyramid", refers loosely to a class of models for representing purported structural and/ or functional relationships between data, information, knowledge, and wisdom. "Typically information is defined in terms of data, knowledge in terms of information, and wisdom in terms of knowledge".
Not all versions of the DIKW model reference all four components (earlier versions not including data, later versions omitting or downplaying wisdom), and some include additional components. [DIKW Pyramid. Wikipedia]
This DIKW pyramid diagram example has 6 levels: measurement, facts, data, information, knowledge, wisdom.
It redesigned using ConceptDraw PRO diagramming and vector drawing software from Wikimedia Commons file Fancom_ Piramide.jpg. [commons.wikimedia.org/ wiki/ File:Fancom_ Piramide.jpg]
This file is licensed under the Creative Commons Attribution-Share Alike 3.0 Unported license. [creativecommons.org/ licenses/ by-sa/ 3.0/ deed.en]
This DIKW pyramid diagram sample is included in the Pyramid Diagrams solution from Marketing area of ConceptDraw Solution Park.
Pyramid diagram
 Pyramid Diagrams
Pyramid Diagrams solution extends ConceptDraw DIAGRAM software with templates, samples and library of vector stencils for drawing the marketing pyramid diagrams.
- Draw A Diagram For Data Hierarchy
- Data Hierarchy Diagram
- In Data Hierarchy Flow Chart
- Data structure diagram with ConceptDraw DIAGRAM | Visio Files ...
- Hierarchical Network Topology | How to Draw an Organization Chart ...
- Knowledge hierarchy triangle diagram | Hierarchy of laws ...
- 4 Level pyramid model diagram - Information systems types | 5 Level ...
- Pyramid Diagram
- Data structure diagram with ConceptDraw PRO | Ou Hierarchy ...
- Knowledge hierarchy triangle diagram | Graham's hierarchy of ...
- Knowledge hierarchy triangle diagram | Pyramid Diagram | Pyramid ...
- 5 Level pyramid model diagram - Information systems types | 4 Level ...
- Software development with ConceptDraw DIAGRAM | Draw The ...
- How to Draw a Pyramid Diagram in ConceptDraw PRO | A Diagram ...
- Venn Diagram Examples for Problem Solving. Computer Science ...
- 5 Levels Of Communication Hierarchy
- Pyramid Charts | Pyramid Diagram | Pyramid Chart Maker ...
- Graham's hierarchy of disagreement - Pyramid diagram | Pyramid ...
- 3D Triangle diagram - Template | Pyramid Diagram | 3D Segmented ...
- Pyramid Diagrams | Pyramid Diagram and Pyramid Chart | Market ...