 Circle-Spoke Diagrams
Examples of subject areas that are well suited to this approach are marketing, business, products promotion, process modeling, market, resource, time, and cost analysis. Circle-Spoke Diagrams are successfully used in presentations, conferences, management documents, magazines, reportages, reviews, reports, TV, and social media.
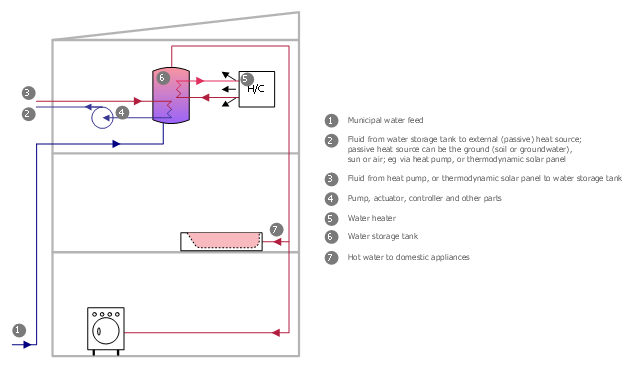
This plumbing and piping plan sample was designed on the base of the Wikimedia Commons file: Active Indirect Water Heater Diagram.svg.
[commons.wikimedia.org/ wiki/ File:Active_ Indirect_ Water_ Heater_ Diagram.svg]
This file is licensed under the Creative Commons Attribution-Share Alike 3.0 Unported license. [creativecommons.org/ licenses/ by-sa/ 3.0/ deed.en]
"Water heating is a thermodynamic process that uses an energy source to heat water above its initial temperature. Typical domestic uses of hot water include cooking, cleaning, bathing, and space heating. In industry, hot water and water heated to steam have many uses.
Domestically, water is traditionally heated in vessels known as water heaters, kettles, cauldrons, pots, or coppers. These metal vessels that heat a batch of water do not produce a continual supply of heated water at a preset temperature. Rarely, hot water occurs naturally, usually from natural hot springs. The temperature varies based on the consumption rate, becoming cooler as flow increases.
Appliances that provide a continual supply of hot water are called water heaters, hot water heaters, hot water tanks, boilers, heat exchangers, geysers, or calorifiers. These names depend on region, and whether they heat potable or non-potable water, are in domestic or industrial use, and their energy source. In domestic installations, potable water heated for uses other than space heating is also called domestic hot water (DHW).
Fossil fuels (natural gas, liquefied petroleum gas, oil), or solid fuels are commonly used for heating water. These may be consumed directly or may produce electricity that, in turn, heats water. Electricity to heat water may also come from any other electrical source, such as nuclear power or renewable energy. Alternative energy such as solar energy, heat pumps, hot water heat recycling, and geothermal heating can also heat water, often in combination with backup systems powered by fossil fuels or electricity." [Water heating. Wikipedia]
The plumbing plan example "Active indirect water heater diagram" was created using the ConceptDraw PRO diagramming and vector drawing software extended with the Plumbing and Piping Plans solution from the Building Plans area of ConceptDraw Solution Park.
Plumbing and piping plan
"A business process or business method is a collection of related, structured activities or tasks that produce a specific service or product (serve a particular goal) for a particular customer or customers. It often can be visualized with a flowchart as a sequence of activities with interleaving decision points or with a Process Matrix as a sequence of activities with relevance rules based on data in the process. ...
There are three types of business processes:
(1) Management processes, the processes that govern the operation of a system. Typical management processes include "corporate governance" and "strategic management".
(2) Operational processes, processes that constitute the core business and create the primary value stream. Typical operational processes are purchasing, manufacturing, advertising and marketing, and sales.
(3) Supporting processes, which support the core processes. Examples include accounting, recruitment, call center, technical support. ...
The ... improvement areas are equally applicable to policies, processes and detailed procedures (sub-processes/ tasks). There is a cascading effect of improvements made at a higher level on those made at a lower level.
For instance, if a recommendation to replace a given policy with a better one is made with proper justification and accepted in principle by business process owners, then corresponding changes in the consequent processes and procedures will follow naturally in order to enable implementation of the policies" [Business process. Wikipedia]
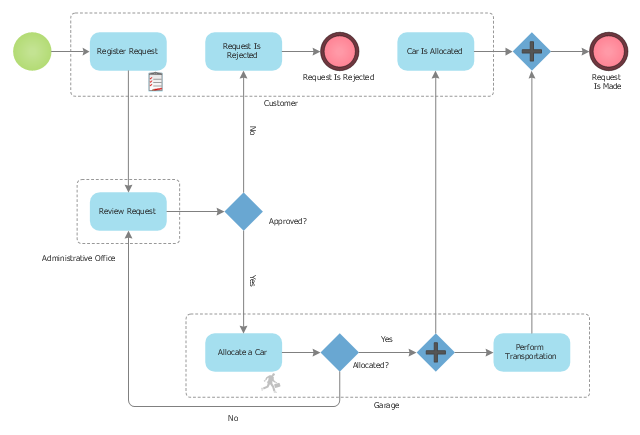
The BPMN 1.2 (Business Process Model and Notation) diagram example "Taxi service order procedure" was created using the ConceptDraw PRO diagramming and vector drawing software extended with the Business Process Diagram solution from the Business Processes area of ConceptDraw Solution Park.
There are three types of business processes:
(1) Management processes, the processes that govern the operation of a system. Typical management processes include "corporate governance" and "strategic management".
(2) Operational processes, processes that constitute the core business and create the primary value stream. Typical operational processes are purchasing, manufacturing, advertising and marketing, and sales.
(3) Supporting processes, which support the core processes. Examples include accounting, recruitment, call center, technical support. ...
The ... improvement areas are equally applicable to policies, processes and detailed procedures (sub-processes/ tasks). There is a cascading effect of improvements made at a higher level on those made at a lower level.
For instance, if a recommendation to replace a given policy with a better one is made with proper justification and accepted in principle by business process owners, then corresponding changes in the consequent processes and procedures will follow naturally in order to enable implementation of the policies" [Business process. Wikipedia]
The BPMN 1.2 (Business Process Model and Notation) diagram example "Taxi service order procedure" was created using the ConceptDraw PRO diagramming and vector drawing software extended with the Business Process Diagram solution from the Business Processes area of ConceptDraw Solution Park.
Taxi service order procedure - BPMN 1.2 diagram
Total Quality Management with ConceptDraw
 method - Fishbone diagram template")
This sample was redesigned from the Wikimedia Commons file: Matrice signes alternants 4x4.svg. "An alternating sign matrix, seen as a puzzle." [commons.wikimedia.org/ wiki/ File:Matrice_ signes_ alternants_ 4x4.svg]
"In mathematics, an alternating sign matrix is a square matrix of 0s, 1s, and −1s such that the sum of each row and column is 1 and the nonzero entries in each row and column alternate in sign. These matrices generalize permutation matrices and arise naturally when using Dodgson condensation to compute a determinant. They are also closely related to the six-vertex model with domain wall boundary conditions from statistical mechanics. They were first defined by William Mills, David Robbins, and Howard Rumsey in the former context." [Alternating sign matrix. Wikipedia]
This file is licensed under the Creative Commons Attribution-Share Alike 3.0 Unported license. [creativecommons.org/ licenses/ by-sa/ 3.0/ deed.en]
The example "Puzzle piece diagram - Alternating sign matrix" was created using the ConceptDraw PRO diagramming and vector drawing software extended with the Marketing Diagrams solution from the Marketing area of ConceptDraw Solution Park.
www.conceptdraw.com/ solution-park/ marketing-diagrams
Puzzle piece diagram

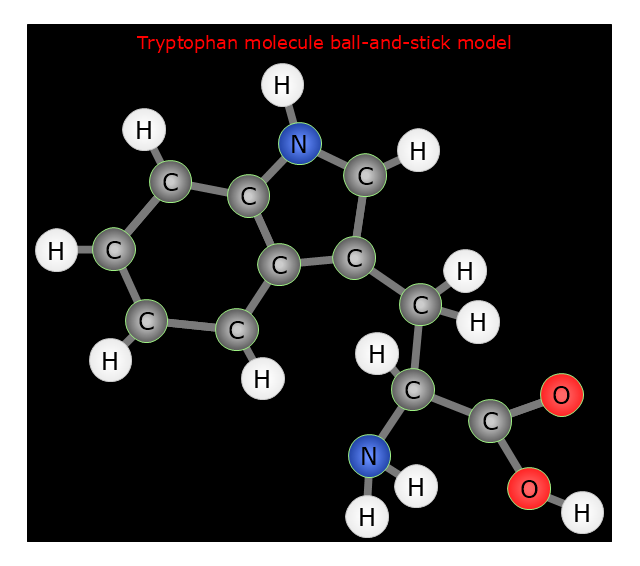
"Tryptophan (IUPAC-IUBMB abbreviation: Trp or W; IUPAC abbreviation: L-Trp or D-Trp; sold for medical use as Tryptan) is one of the 22 standard amino acids and an essential amino acid in the human diet, as demonstrated by its growth effects on rats. It is encoded in the standard genetic code as the codon UGG. Only the L-stereoisomer of tryptophan is used in structural or enzyme proteins, but the R -stereoisomer is occasionally found in naturally produced peptides (for example, the marine venom peptide contryphan). The distinguishing structural characteristic of tryptophan is that it contains an indole functional group." [Tryptophan. Wikipedia]
The chemical drawing example "Tryptophan molecule ball-and-stick model" was created using the ConceptDraw PRO software extended with the Chemistry solution from the Science and Education area of ConceptDraw Solution Park.
The chemical drawing example "Tryptophan molecule ball-and-stick model" was created using the ConceptDraw PRO software extended with the Chemistry solution from the Science and Education area of ConceptDraw Solution Park.
Tryptophan amino acid
Design Pictorial Infographics. Design Infographics

 Health Food
The Health Food solution contains the set of professionally designed samples and large collection of vector graphic libraries of healthy foods symbols of fruits, vegetables, herbs, nuts, beans, seafood, meat, dairy foods, drinks, which give powerful possi
Healthy Foods

Healthy Diet Plan

Geo Map - Europe - Norway

The vector stencils library "Resources and energy" contains 19 clipart images for drawing illustrations on resources and energy.
"Natural resources occur naturally within environments that exist relatively undisturbed by humanity, in a natural form. A natural resource is often characterized by amounts of biodiversity and geodiversity existent in various ecosystems.
Natural resources are derived from the environment. Some of them are essential for our survival while most are used for satisfying our wants. Natural resources may be further classified in different ways.
Natural resources are materials and components (something that can be used) that can be found within the environment. Every man-made product is composed of natural resources (at its fundamental level). A natural resource may exist as a separate entity such as fresh water, and air, as well as a living organism such as a fish, or it may exist in an alternate form which must be processed to obtain the resource such as metal ores, oil, and most forms of energy." [Natural resource. Wikipedia]
The clip art example "Resources and energy - Vector stencils library" was created in ConceptDraw PRO diagramming and vector drawing software using the Manufacturing and Maintenance solution from the Illustration area of ConceptDraw Solution Park.
Human resources

Batteries

Wind turbine

Transmission tower

Natural gas burner

Solar panel

Lightning

Ionizing radiation hazard sign

High voltage symbol

Atom

Incandescent light bulb

Oil barrels

Power station

Wood

Perpetuum mobile

Hydroelectric dam

Liquefied petroleum gas

Natural gas

Minecart with coal

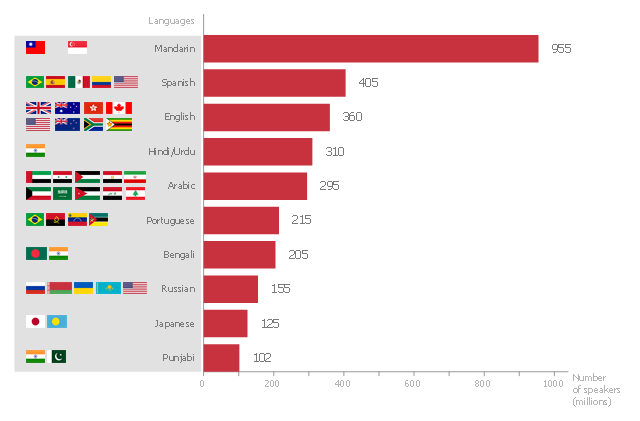
This bar graph sample shows the number of speakers for the most spoken languages of the world.
"In the philosophy of language, a natural language (or ordinary language) is any language which arises in an unpremeditated fashion as the result of the innate facility for language possessed by the human intellect. A natural language is typically used for communication, and may be spoken, signed, or written. Natural language is distinguished from constructed languages and formal languages such as computer-programming languages or the "languages" used in the study of formal logic, especially mathematical logic. ... Though the exact definition varies between scholars, natural language can broadly be defined in contrast on the one hand to artificial or constructed languages, computer programming languages like Python and international auxiliary languages like Esperanto, and on the other hand to other communication systems in nature, such as the waggle dance of bees. Although there are a variety of natural languages, any cognitively normal human infant is able to learn any natural language. By comparing the different natural languages, scholars hope to learn something about the nature of human intelligence and the innate biases and constraints that shape natural language, which are sometimes called universal grammar. The term "natural language" refers only a language that has developed naturally, and hence to actual speech, rather than prescribed speech. Hence, unstandardized speech (such as African American Vernacular English) is natural, whereas standardized speech such as Standard American English, which is in part prescribed, is somewhat artificial." [Natural language. Wikipedia]
The horizontal bar chart example "The most spoken languages of the world" was created using the ConceptDraw PRO diagramming and vector drawing software extended with the Bar Graphs solution from the Graphs and Charts area of ConceptDraw Solution Park.
Horizontal bar graph
HelpDesk
ConceptDraw STORE - ConceptDraw Apps

- Diagrams Of Natural Resources
- Energy Pyramid Diagram | Energy resources diagram | Resources ...
- Natural Resources Diagrams
- Energy resources diagram | Target and Circular Diagrams ...
- Natural Resources And Human Resources Diagram
- Energy Level Diagram Natural Sourcrs
- Design elements - Lighting | Data Flow Diagram (DFD) | Pie Charts ...
- Energy resources diagram | Resources and energy - Vector stencils ...
- Energy resources diagram | Resources and energy - Vector stencils ...
- Process Flow Diagram | Technical Drawing Software | Resources ...
- Amine treating unit schematic diagram | Picture Graphs | Resources ...
- Natural And Artificial Sources Of Light Drawing
- Natural gas condensate - PFD | Global natural gas consumption ...
- Resources and energy - Vector stencils library | Human Resource ...
- Energy Pyramid Diagram | How to Create a Scatter Chart | Chart ...
- Resources and energy - Vector stencils library | Energy resources ...
- Energy resources diagram | Types of Flowcharts | Resources and ...
- Energy resources diagram | Energy Pyramid Diagram | Resources ...
- Electrical Symbols, Electrical Diagram Symbols | Workflow Diagram ...
- The most spoken languages of the world | Venn Diagram Examples ...