Design Data Flow. DFD Library

"Data flow diagrams are one of the three essential perspectives of the structured-systems analysis and design method SSADM. The sponsor of a project and the end users will need to be briefed and consulted throughout all stages of a system's evolution. With a data flow diagram, users are able to visualize how the system will operate, what the system will accomplish, and how the system will be implemented. The old system's dataflow diagrams can be drawn up and compared with the new system's data flow diagrams to draw comparisons to implement a more efficient system. Data flow diagrams can be used to provide the end user with a physical idea of where the data they input ultimately has an effect upon the structure of the whole system from order to dispatch to report. How any system is developed can be determined through a data flow diagram model.
In the course of developing a set of levelled data flow diagrams the analyst/ designers is forced to address how the system may be decomposed into component sub-systems, and to identify the transaction data in the data model.
Data flow diagrams can be used in both Analysis and Design phase of the SDLC.
There are different notations to draw data flow diagrams (Yourdon & Coad and Gane & Sarson), defining different visual representations for processes, data stores, data flow, and external entities." [Data flow diagram. Wikipedia]
The DFD (Yourdon and Coad notation) example "Process of account receivable" was created using the ConceptDraw PRO diagramming and vector drawing software extended with the Data Flow Diagrams solution from the Software Development area of ConceptDraw Solution Park.
Data Flow Diagram

The vector stencils library "Data flow diagram (DFD)" contains 15 DFD elements.
Use it for process-oriented models, data-oriented models, data flowcharts, data process diagrams, structured analysis diagrams, and information flow diagrams in the ConceptDraw PRO diagramming and vector drawing software extended with the Data Flow Diagrams solution from the Software Development area of ConceptDraw Solution Park.
Use it for process-oriented models, data-oriented models, data flowcharts, data process diagrams, structured analysis diagrams, and information flow diagrams in the ConceptDraw PRO diagramming and vector drawing software extended with the Data Flow Diagrams solution from the Software Development area of ConceptDraw Solution Park.
State (Multi State)
-data-flow-diagram-(dfd)---vector-stencils-library.png--diagram-flowchart-example.png)
State (Multi State)
-data-flow-diagram-(dfd)---vector-stencils-library.png--diagram-flowchart-example.png)
State (Multi State)
-data-flow-diagram-(dfd)---vector-stencils-library.png--diagram-flowchart-example.png)
Stop state 2
---vector-stencils-library.png--diagram-flowchart-example.png)
External Interactor
---vector-stencils-library.png--diagram-flowchart-example.png)
Entity Relationship
---vector-stencils-library.png--diagram-flowchart-example.png)
Oval process
---vector-stencils-library.png--diagram-flowchart-example.png)
Object
---vector-stencils-library.png--diagram-flowchart-example.png)
Entity
---vector-stencils-library.png--diagram-flowchart-example.png)
Entity (Rounded Corners)
-data-flow-diagram-(dfd)---vector-stencils-library.png--diagram-flowchart-example.png)
Entity with ID and Location Mention(Rounded Corners)
-data-flow-diagram-(dfd)---vector-stencils-library.png--diagram-flowchart-example.png)
Data store 1
---vector-stencils-library.png--diagram-flowchart-example.png)
Data store 2
---vector-stencils-library.png--diagram-flowchart-example.png)
Data store 3
---vector-stencils-library.png--diagram-flowchart-example.png)
Data store (with ID)
-data-flow-diagram-(dfd)---vector-stencils-library.png--diagram-flowchart-example.png)
This DFD sample was created on the base of the figure from the NASA website. [asd-www.larc.nasa.gov/ ATBD/ DFD.html]
"Clouds and the Earth's Radiant Energy System (CERES).
EOS-Terra: Understanding Earth's Clouds and Climate.
The Clouds and the Earth's Radiant Energy System (CERES) instrument is one of several that will be flown aboard the Earth Observing System's Terra spacecraft, scheduled for launch in late1999. The data from the CERES instrument will be used to study the energy exchanged between the Sun; the Earth's atmosphere, surface and clouds; and outer space.
The CERES EOS-Terra instrument will be the second CERES instrument in Earth orbit. The first CERES instrument is currently orbiting the Earth aboard the Tropical Rainfall Measuring Mission observatory, which was launched in November 1997. Early results of the TRMM mission show that the first CERES has provided better measurement capabilities than any previous satellite instrument of its kind.
What CERES Will Measure.
CERES will measure the energy at the top of the atmosphere, as well as estimate energy levels in the atmosphere and at the Earth's surface. Using information from very high resolution cloud imaging instruments on the same spacecraft, CERES also will determine cloud properties, including cloud amount, altitude, thickness, and the size of the cloud particles. All of these measurements are critical for advancing our understanding of the Earth's total climate system and further improving climate prediction models.
The CERES instrument is based on NASA Langley's highly successful Earth Radiation Budget Experiment (ERBE) which used three satellites to provide global energy budget measurements from 1984 to 1990." [nasa.gov/ centers/ langley/ news/ factsheets/ CERES.html]
The DFD example "CERES data flow diagram" was created using the ConceptDraw PRO diagramming and vector drawing software extended with the Data Flow Diagrams solution from the Software Development area of ConceptDraw Solution Park.
DFD

"A data flow diagram (DFD) is a graphical representation of the "flow" of data through an information system. It differs from the flowchart as it shows the data flow instead of the control flow of the program. A data flow diagram can also be used for the visualization of data processing (structured design). Data flow diagrams were invented by Larry Constantine, the original developer of structured design, based on Martin and Estrin's "data flow graph" model of computation.
It is common practice to draw a context-level Data flow diagram first which shows the interaction between the system and outside entities. The DFD is designed to show how a system is divided into smaller portions and to highlight the flow of data between those parts. This context-level Data flow diagram is then "exploded" to show more detail of the system being modeled" [Data model. Wikipedia]
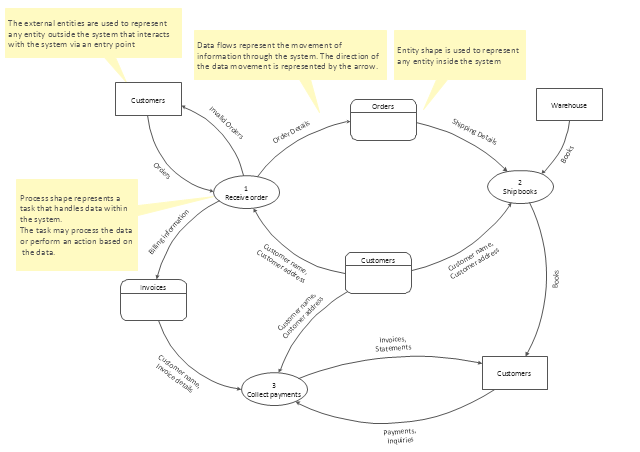
The DFD (Yourdon and Coad notation) example "Model of small traditional production enterprise" was created using the ConceptDraw PRO diagramming and vector drawing software extended with the Data Flow Diagrams solution from the Software Development area of ConceptDraw Solution Park.
It is common practice to draw a context-level Data flow diagram first which shows the interaction between the system and outside entities. The DFD is designed to show how a system is divided into smaller portions and to highlight the flow of data between those parts. This context-level Data flow diagram is then "exploded" to show more detail of the system being modeled" [Data model. Wikipedia]
The DFD (Yourdon and Coad notation) example "Model of small traditional production enterprise" was created using the ConceptDraw PRO diagramming and vector drawing software extended with the Data Flow Diagrams solution from the Software Development area of ConceptDraw Solution Park.
Data Flow Diagram Model

Data Flow Diagrams (DFD) visualize data flows in information systems.
They show: what kinds of data input to and output from the system; where the data come from and go to; where the data is stored.
DFDs are used for design and analysis of business and engineering information systems.
They are also used for data processing visualization.
They show: what kinds of data input to and output from the system; where the data come from and go to; where the data is stored.
DFDs are used for design and analysis of business and engineering information systems.
They are also used for data processing visualization.
DFD template
This example was redesigned from the Wikipedia file: LastResortHotel BookRoom Process.png. [en.wikipedia.org/ wiki/ File:LastResortHotel_ BookRoom_ Process.png]
This file is licensed under the Creative Commons Attribution-ShareAlike 3.0 License. [creativecommons.org/ licenses/ by-sa/ 3.0/ ]
"Event partitioning is an easy-to-apply systems analysis technique that helps the analyst organize requirements for large systems into a collection of smaller, simpler, minimally-connected, easier-to-understand ‘mini systems’ / use cases. ...
Defining requirements.
Single process in a fictitious hotel using data flow diagram notation.
Single use case in a fictitious hotel using use case diagram notation.
This approach helps the analyst to decompose the system into ‘mentally bite-sized’ mini-systems using events that require a planned response. The level of detail of each response is at the level of ‘primary use cases’. Each planned response may be modelled using DFD notation or as a single use case using use case diagram notation.
The basic flow within a process or use case can usually be described in a relatively small number of steps, often fewer than twenty or thirty, possibly using something like ‘structured English’. Ideally, all of the steps would be visible all at once (often a page or less). The intention is to reduce one of the risks associated with short-term memory, namely, forgetting what is not immediately visible (‘out of sight, out of mind’). ...
Single process in a fictitious hotel using data flow diagram notation." [Event partitioning. Wikipedia]
The DFD example "Last resort hotel book room process" was created using the ConceptDraw PRO diagramming and vector drawing software extended with the Data Flow Diagrams solution from the Software Development area of ConceptDraw Solution Park.
DFD

UML Use Case Diagram. Design Elements
")

Business Process Modeling Tools

Business Process Modeling

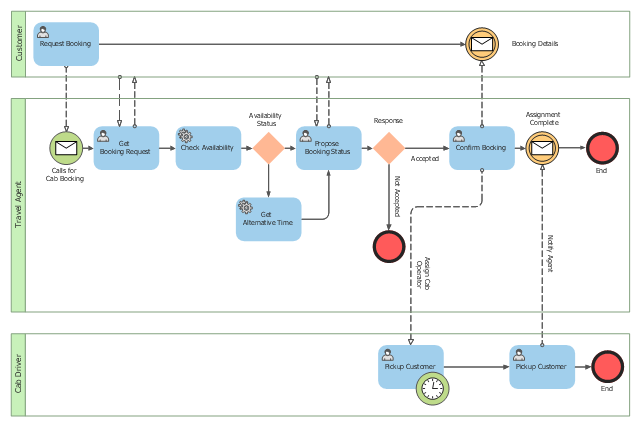
This BPMN (Business Process Model and Notation) collaboration diagram sample depicts interactions between customer, travel agent and cab driver, which are defined as a sequence of activities, and represent the message exchange during a cab booking process.
"Business process modeling is used to communicate a wide variety of information to a wide variety of audiences. BPMN is designed to cover this wide range of usage and allows modeling of end-to-end business processes to allow the viewer of the Diagram to be able to easily differentiate between sections of a BPMN Diagram. There are three basic types of sub-models within an end-to-end BPMN model: Private (internal) business processes, Abstract (public) processes, and Collaboration (global) processes...
Collaboration (global) processes.
A collaboration process depicts the interactions between two or more business entities. These interactions are defined as a sequence of activities that represent the message exchange patterns between the entities involved. Collaboration processes may be contained within a Pool and the different participant business interactions are shown as Lanes within the Pool. In this situation, each Lane would represent two participants and a direction of travel between them. They may also be shown as two or more Abstract Processes interacting through Message Flow. These processes can be modeled separately or within a larger BPMN Diagram to show the Associations between the collaboration process activities and other entities. If the collaboration process is in the same Diagram as one of its corresponding private business process, then the activities that are common to both processes can be associated." [Business Process Model and Notation. Wikipedia]
The business process modeling diagram example "Cab booking public process - Collaboration BPMN 2.0 diagram" was designed using the ConceptDraw PRO diagramming and vector drawing software extended with the Business Process Diagram solution from the Business Processes area of ConceptDraw Solution Park.
Business process modeling
Object-Oriented Design

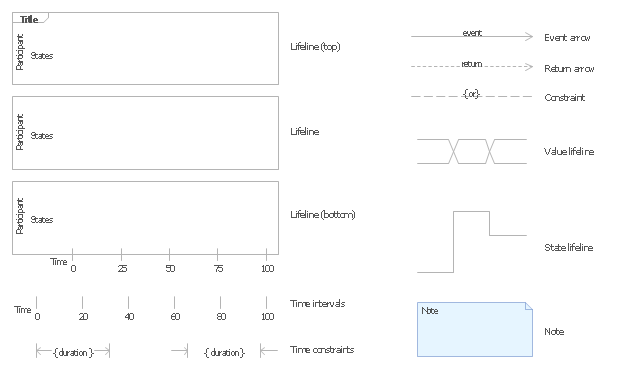
The vector stencils library "UML timing diagrams" contains 15 symbols for the ConceptDraw PRO diagramming and vector drawing software.
"The following nodes and edges are typically drawn in a UML timing diagram: lifeline, state or condition timeline, destruction event, duration constraint, time constraint. ...
Lifeline is a named element which represents an individual participant in the interaction. ... lifelines represent only one interacting entity. ...
Lifeline on the timing diagrams is represented by the name of classifier or the instance it represents. It could be placed inside diagram frame or a "swimlane". ...
Timing diagram could show states of the participating classifier or attribute, or some testable conditions, such as a discrete or enumerable value of an attribute. ...
UML also allows the state/ condition dimension be continuous. It could be used in scenarios where entities undergo continuous state changes, such as temperature or density. ...
Destruction occurrence is a message occurrence which represents the destruction of the instance described by the lifeline. It may result in the subsequent destruction of other objects that this object owns by composition. No other occurrence may appear after the destruction event on a given lifeline.
Complete UML name of the occurrence is destruction occurrence specification. Until UML 2.4 it was called destruction event, and earlier - stop.
The destruction event is depicted by a cross in the form of an X at the end of a timeline. ...
Duration constraint is an interval constraint that refers to a duration interval. The duration interval is duration used to determine whether the constraint is satisfied.
The semantics of a duration constraint is inherited from constraints. If constraints are violated, traces become negative which means that system is considered as failed.
Duration constraint is shown as some graphical association between a duration interval and the constructs that it constrains. ...
Time constraint is an interval constraint that refers to a time interval. The time interval is time expression used to determine whether the constraint is satisfied.
The semantics of a time constraint is inherited from constraints. All traces where the constraints are violated are negative traces, i.e., if they occur, the system is considered as failed.
Time constraint is shown as graphical association between a time interval and the construct that it constrains. Typically this graphical association is a small line, e.g., between an occurrence specification and a time interval." [uml-diagrams.org/ timing-diagrams.html]
The example "Design elements - UML timing diagrams" is included in the Rapid UML solution from the Software Development area of ConceptDraw Solution Park.
UML timing diagram symbols
Process Flowchart


Example of DFD for Online Store (Data Flow Diagram) DFD Example


- Data Flow Diagram Process
- DFD, Yourdon and Coad notation - Vector stencils library | DFD ...
- Data flow diagram (DFD) - Vector stencils library | Design Data Flow ...
- DFD - Process of account receivable | Class UML Diagram for Bank ...
- Data Flow Diagram Symbols. DFD Library | DFD, Yourdon and Coad ...
- Data flow diagram
- Data Store Diagram
- Data Flow Diagram Yourdon And Coad
- Design Data Flow. DFD Library | DFD Library - Design elements ...
- Data Flow Diagram Process | Why Flowchart Important to ...
- Process Flowchart | Data flow diagram (DFD) - Vector stencils library ...
- Design Data Flow. DFD Library | Data flow diagram (DFD) - Vector ...
- Yourdon and Coad Diagram | Booch OOD Diagram | DFD, Yourdon ...
- Data Flow Diagram Yourdon
- DFD Library - Design elements | DFD - Process of account ...
- Example of DFD for Online Store (Data Flow Diagram ) DFD ...
- Data flow diagram - Template
- Data Flow Diagram Process | DFD - Process of account receivable ...
- Data Flow Diagram Symbols. DFD Library | DFD Library System ...
- DFD - Process of account receivable | Data Flow Diagram Process ...