PROBLEM ANALYSIS. Root Cause Analysis Tree Diagram


 Fault Tree Analysis Diagrams
This solution extends ConceptDraw PRO v9.5 or later with templates, fault tree analysis example, samples and a library of vector design elements for drawing FTA diagrams (or negative analytical trees), cause and effect diagrams and fault tree diagrams.
 Fishbone Diagram
Fishbone Diagrams solution extends ConceptDraw PRO software with templates, samples and library of vector stencils for drawing the Ishikawa diagrams for cause and effect analysis.
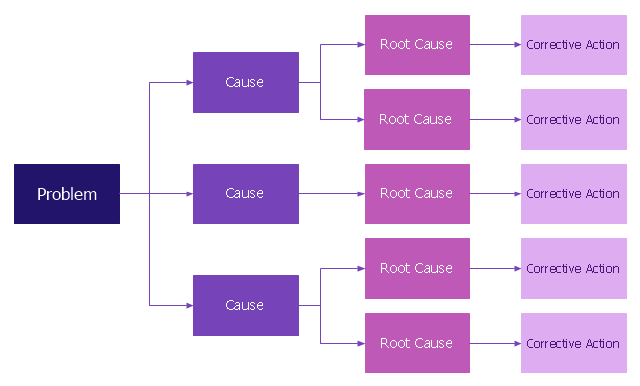
Root cause analysis (RCA) tree diagram lets identify the root causes for a factor and then list possible corrective action. The diagram displays the structure of causes for a factor and possible corrective actions. The root cause analysis tree diagram is used for further formulation of actions.
"Tree Diagram.
This tool is used to break down broad categories into finer and finer levels of detail. It can map levels of details of tasks that are required to accomplish a goal or solution or task. Developing the tree diagram helps one move their thinking from generalities to specifics." [Seven Management and Planning Tools. Wikipedia]
This root cause analysis tree diagram template for the ConceptDraw PRO diagramming and vector drawing software is included in the Seven Management and Planning Tools solution from the Management area of ConceptDraw Solution Park.
RCA diagram
Structured Systems Analysis and Design Method (SSADM) with ConceptDraw PRO

HelpDesk
How to Create a Fault Tree Analysis Diagram (FTD) in ConceptDraw PRO

CORRECTIVE ACTIONS PLANNING. Risk Diagram (PDPC)
 - Health care")
Cause and Effect Analysis - Fishbone Diagrams for Problem Solving

Marketing Analysis Diagram

Process Flowchart


"Root cause analysis (RCA) is a method of problem solving that tries to identify the root causes of faults or problems.
RCA practice tries to solve problems by attempting to identify and correct the root causes of events, as opposed to simply addressing their symptoms. Focusing correction on root causes has the goal of preventing problem recurrence. RCFA (Root Cause Failure Analysis) recognizes that complete prevention of recurrence by one corrective action is not always possible.
Conversely, there may be several effective measures (methods) that address the root causes of a problem. Thus, RCA is an iterative process and a tool of continuous improvement.
RCA is typically used as a reactive method of identifying event(s) causes, revealing problems and solving them. Analysis is done after an event has occurred. Insights in RCA may make it useful as a preemptive method. In that event, RCA can be used to forecast or predict probable events even before they occur. While one follows the other, RCA is a completely separate process to Incident Management." [Root cause analysis. Wikipedia]
The root cause analysis (RCA) tree diagram example "Manufacturing problem solution" was created using the ConceptDraw PRO diagramming and vector drawing software extended with the solution "Seven Management and Planning Tools" from the Management area of ConceptDraw Solution Park.
Tree diagram

Software for Creating SWOT Analysis Diagrams

PROBLEM ANALYSIS. Relations Diagram

Cause and Effect Analysis

Cause and Effect Analysis

- PROBLEM ANALYSIS . Root Cause Analysis Tree Diagram | How To ...
- PROBLEM ANALYSIS . Root Cause Analysis Tree Diagram | Root ...
- Fault Tree Analysis Diagrams | Process Flowchart | Fishbone ...
- Using Fishbone Diagrams for Problem Solving | Cause and Effect ...
- Structured Systems Analysis and Design Method (SSADM) with ...
- Root cause analysis tree diagram - Template | Fault Tree Analysis ...
- Cause and Effect Analysis (Fishbone Diagrams ) | How To Create ...
- Structured Systems Analysis and Design Method (SSADM) with ...
- Cause and Effect Analysis | Fishbone Diagram | Cause and Effect ...
- PROBLEM ANALYSIS . Prioritization Matrix | PROBLEM ANALYSIS ...
- PROBLEM ANALYSIS . Root Cause Analysis Tree Diagram ...
- FTA diagram - Hazard analysis | Accident analytic tree - FTA ...
- PROBLEM ANALYSIS . Root Cause Analysis Tree Diagram | How to ...
- SWOT Analysis | SWOT analysis matrix diagram templates ...
- Porter's value chain diagram - Template | SWOT analysis matrix ...
- Manufacturing 8 Ms fishbone diagram - Template | Business ...
- Fishbone Diagram Poor Quality Of Product
- PROBLEM ANALYSIS . Relations Diagram | PROBLEM ANALYSIS ...
- Cause and Effect Analysis (Fishbone Diagrams )
- SWOT Analysis | Block diagram - Porter's five forces model | SWOT ...