Gane Sarson Diagram
The Gane-Sarson methodology uses the graphical techniques for building the logical models for the systems. It is helpful for analysts and designers to make common and clear picture of the system, to depict all its processes and how they transform the data. The Gane-Sarson methodology lets represent all this information in a way understandable for the users and other interested people, and gives the possibility to see instantly how the system's parts serve together to meet their needs. This methodology supposes the building of a system top-down. First you need create an overall system data flow, then determine the details of the data structures, the process logic and design the modular structures. ConceptDraw DIAGRAM diagramming and vector drawing software offers the Data Flow Diagrams solution with Gane-Sarson Notation library rich for the specific symbols of the Gane-Sarson notation. All they are vector and fully ready-to-use for drawing the Data Flow Diagrams, which will be then successfully used in presentations, websites, and various business documents.Taxi Service Data Flow Diagram DFD Example
This sample shows the Data Flow Diagram of the Taxi Service and interactions between the Clients, Operators and Divers, as well as Orders and Reports databases.
 Data Flow Diagrams (DFD)
Data Flow Diagrams solution extends ConceptDraw DIAGRAM software with templates, samples and libraries of vector stencils for drawing the data flow diagrams (DFD).
DFD Flowchart Symbols
A Data Flow Diagram (DFD) is a graphical technique which allows effectively model and analyze the information processes and systems. The ability to fast and easy create the DFDs is made possible with Data Flow Diagrams solution from the Software Development area of ConceptDraw Solution Park. For designing the Data Flow Diagrams are used simple DFD flowchart symbols which are connected each other by arrows depicting the data flow from one step to another.Data Flow Diagram Example
ConceptDraw DIAGRAM extended with Data Flow Diagrams solution is the best diagramming and vector drawing software for quick and easy designing the Data Flow Diagram Example of any complexity.Process Flow Maps
What is a Process Flow Map? It is a chart which visually illustrates a business process and how its steps work together. Process Flow Maps help companies define problem areas, inefficient activities for the purpose of further increasing performance and profitability of businesses. ConceptDraw DIAGRAM diagramming and vector drawing software extended with Flowcharts solution from the "Diagrams" area of ConceptDraw Solution Park is efficient and productive software for fast and simple creating professional looking Process Flow Map.Fishbone Diagram Design Element
ConceptDraw DIAGRAM diagramming and vector drawing software extended with Fishbone Diagrams solution is a perfect tool for software designers and software developers. If you need to create Cause and Effect diagram, Fishbone diagram, Ishikawa diagram from templates and examples, or using the predesigned elements, ConceptDraw DIAGRAM can do this easily. ConceptDraw DIAGRAM software gives ability to design Fishbone diagrams that identify many possible causes for an effect for problem. Each Fishbone diagram design element included to Fishbone Diagrams library is vector and ready-to-use.Business Productivity - Management
The widespread of Mind Maps in the field of management is justified and very convenient. The managers and leaders work with large amount of information and data, and need the useful tools for its structuring and systemizing. They prefer to use the powerful Mind Mapping software that gives them a lot of benefits. ConceptDraw MINDMAP is professional software for management, business planning, strategic planning, business productivity and development. It provides the powerful tools which help managers to be effective and improve their productivity, supports them in easy visual documenting and communication the management information. Use ConceptDraw MINDMAP to build the Management Diagrams (Matrices, Organizational Charts, Deployment Charts, Timelines, Cause & Effect (Fishbone) Diagrams) and key management Mind Maps (SWOT analysis, problem solving, decision making, business planning, scheduling, thinking ideas, company organizing, preparing and holding the meetings and presentations) quickly and easily.Gantt charts for planning and scheduling projects
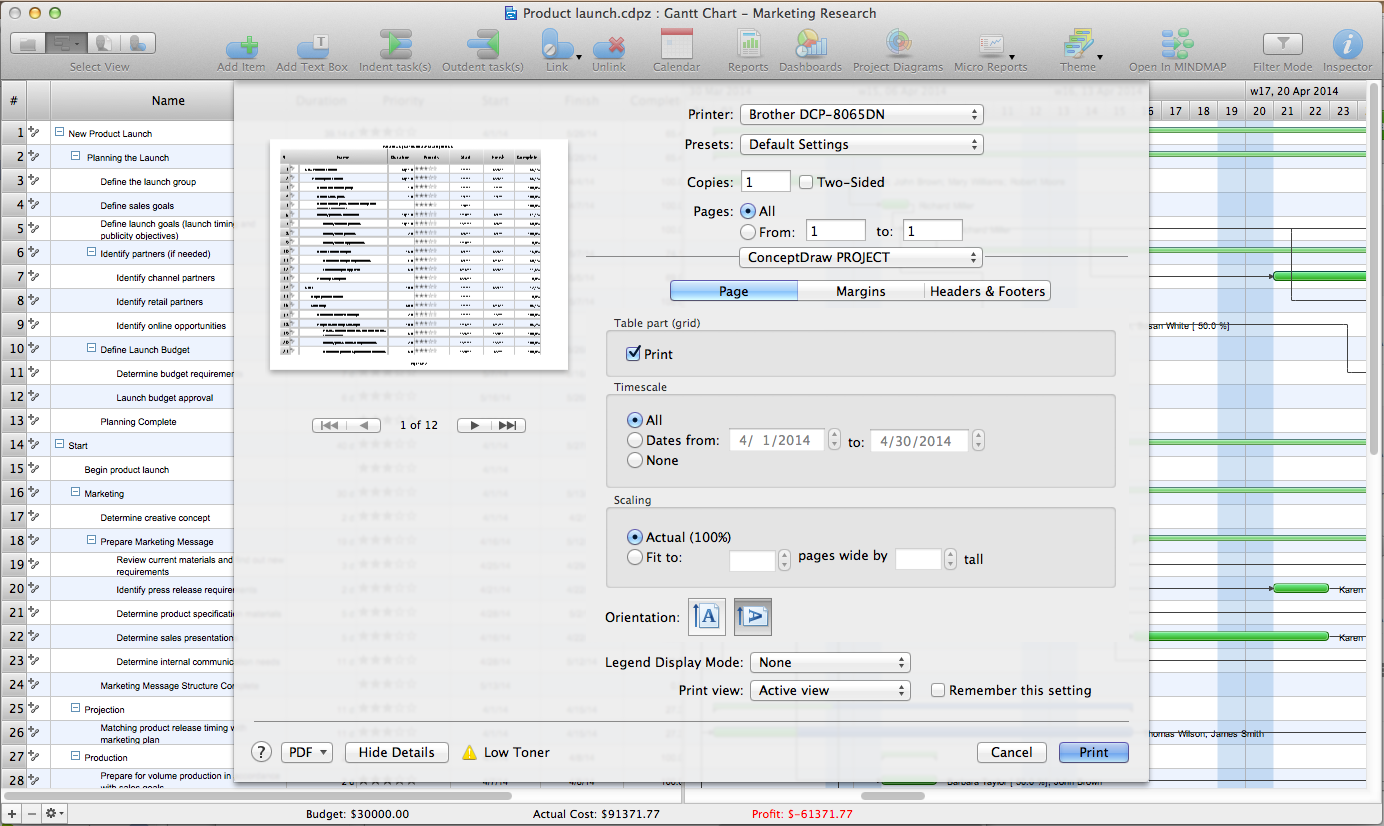
ConceptDraw PROJECT is an excellent simple project scheduling software. It maintain classic project gantt charts and the line of professional reports on resources usage. It include handy critical path scheduling software tools and diagraming tools which helps prepare the presentation of project status. It include project tracking dashboard to keep project metrics upto date, also it have handy feature to export project management dashboard in excel file.Advanced printing in ConceptDraw PROJECT
ConceptDraw PROJECT has flexible print settings that allowing you to easily print your project data to suite any need.- Data Flow Diagrams ( DFD ) | Dfd Diagram Of Class Scheduling System
- Data Flow Diagram Scheduling System
- Taxi Service Data Flow Diagram DFD Example | Gantt Chart ...
- Data Flow Diagram Of Class Scheduling System
- Example Of Data Flow Diagram In Event Scheduling
- How To Make A Data Flow Diagram In Class Scheduling System
- Dfd Diagram Of Cab Scheduling And Booking System
- Gantt charts for planning and scheduling projects | Project planning ...
- Data Flow Diagrams ( DFD ) | Calendars | Business diagrams & Org ...
- Flow Chart Scheduling System


.png)


