Process Flowchart


Business diagrams & Org Charts with ConceptDraw PRO


Gane Sarson Diagram

 Divided Bar Diagrams
The Divided Bar Diagrams Solution extends the capabilities of ConceptDraw PRO v10 with templates, samples, and a library of vector stencils for drawing high impact and professional Divided Bar Diagrams and Graphs, Bar Diagram Math, and Stacked Graph.
Flowchart

Affinity Diagram

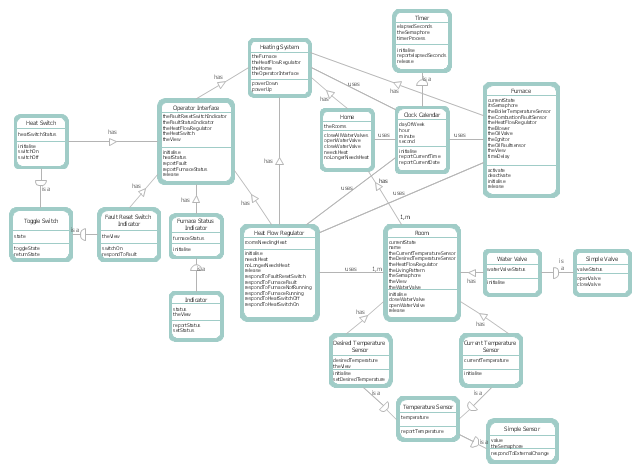
This DFD sample was created on the base of the figure illustrating "A Survey of Object-Oriented Methods" by Peter Biggs from University of Durham.
[students.cs.byu.edu/ ~pbiggs/ images/ coadsys.gif]
"Object-oriented analysis and design (OOAD) is a popular technical approach to analyzing, designing an application, system, or business by applying the object-oriented paradigm and visual modeling throughout the development life cycles to foster better stakeholder communication and product quality.
According to the popular guide Unified Process, OOAD in modern software engineering is best conducted in an iterative and incremental way. Iteration by iteration, the outputs of OOAD activities, analysis models for OOA and design models for OOD respectively, will be refined and evolve continuously driven by key factors like risks and business values." [Object-oriented analysis and design. Wikipedia]
The DFD example "Coad/ Yourdon's Object-Oriented Analysis model" was created using the ConceptDraw PRO diagramming and vector drawing software extended with the Data Flow Diagrams solution from the Software Development area of ConceptDraw Solution Park.
DFD
Competitor Analysis

Discover Plans Question

 Target and Circular Diagrams
This solution extends ConceptDraw PRO software with samples, templates and library of design elements for drawing the Target and Circular Diagrams.
Business Process Workflow Diagram

Local area network (LAN). Computer and Network Examples
. Computer and Network Examples")

Pyramid Chart Examples

- Data Flow Diagram Symbols. DFD Library | Example of DFD for ...
- Data Flow Diagram For Mobile Apps Example
- Schematic Diagram Of Baseline Survey Process
- Data Flow Diagram Symbols. DFD Library | ConceptDraw PRO DFD ...
- Process Flowchart | Data Flow Diagrams | Bank UML Diagram ...
- Data Flow Diagram Symbols. DFD Library | Coad/Yourdon's Object ...
- Quick YouTube Survey | HR workflow - Vector stencils library | Post ...
- Object-Oriented Design | Booch OOD Diagram | Coad/Yourdon's ...
- Survey Process Diagram
- Pyramid Diagram | Organizational Structure | Process Flowchart ...
- Data Flow Diagram (DFD) | Relations Diagram | MindTweet | Data ...
- Business diagrams & Org Charts with ConceptDraw PRO | Local ...
- Picture Graphs | Data Flow Diagram Youtube
- Er Diagram For Product Survey Analysis
- Survey Concept Maps Diagram
- Coad/Yourdon's Object-Oriented Analysis model | Data Flow ...
- Survey Process Flowchart Icon
- Data Flow Diagram (DFD) | UML Component Diagram | MindTweet ...
- Hiring process workflow | Business diagrams & Org Charts with ...
- Quick YouTube Survey | The increse in subscibers on YouTube to ...