This site uses cookies. By continuing to browse the ConceptDraw site you are agreeing to our Use of Site Cookies.

fault tree analysis, fishbone diagram, cause and effect diagrams, fault tree analysis software, fault tree analysis example Fault Tree Analysis Diagrams

fault tree analysis, fishbone diagram, cause and effect diagrams, fault tree analysis software, fault tree analysis example
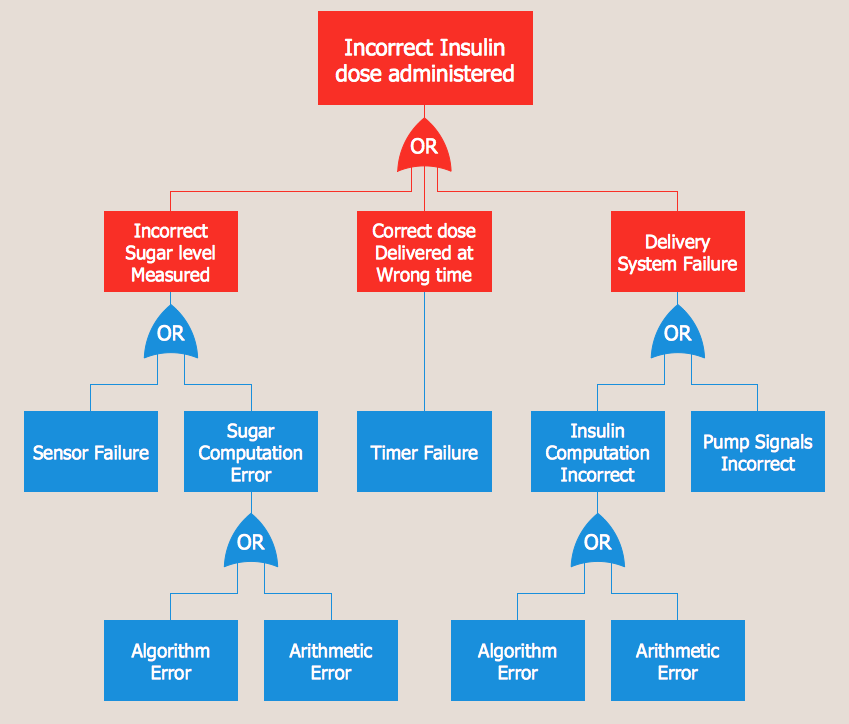
This solution extends ConceptDraw DIAGRAM.5 or later with templates, fault tree analysis example, samples and a library of vector design elements for drawing FTA diagrams (or negative analytical trees), cause and effect diagrams and fault tree diagrams.
HelpDesk

How to Create a Fault Tree Analysis Diagram (FTD)

Fault Tree Diagram is a logic diagram that shows the state of an entire system in a relationship of the conditions of its elements. Fault Tree Diagram is used to analyze the probability of functional system failures and safety accidents. ConceptDraw DIAGRAM allows you to create professional Fault Tree Diagrams using the basic FTD symbols. An FTD visualizes a model of the processes within a system that can lead to the unlikely event. A fault tree diagrams are created using standard logic symbols. The basic elements in a fault tree diagram are gates and events.

Fault Tree Diagram

ConceptDraw DIAGRAM diagramming and vector drawing software offers the Fault Tree Analysis Diagrams Solution from the Industrial Engineering Area of ConceptDraw Solution Park for quick and easy creating the Fault Tree Diagram of any degree of detailing.

Active Directory Diagram

Active Directory Diagram represents the scheme of correlations of service components with the preset degree of the detailed elaboration. Such diagram lets plan and service the existing network quicker and more qualitatively and presents the clear picture of the network structure in graphical format.
With the help of ConceptDraw DIAGRAM extended with Active Directory Diagrams Solution from the Computer and Networks Area you can easily and quickly create the highly detailed Active Directory Diagram.

Fault Tree Analysis Example

Designing the Fault Tree Analysis (FTA) Diagrams first of all it is important to have a powerful software. ConceptDraw DIAGRAM diagramming and vector drawing software extended with Fault Tree Analysis Diagrams Solution from the Industrial Engineering Area is exactly what you need. It is also convenient to have professional looking Fault Tree Analysis example before the eyes, and it is excellent that this solution includes large collection of such examples.

site plan, landscape design plan Site Plans

site plan, landscape design plan
The Site Plans solution extends ConceptDraw DIAGRAM with samples, templates and numerous libraries of design elements making it powerful site plan software, ideal for landscape drawing, designing Site Plans, Site Layout Plans, Landscape Design Drawings, Home Site Plans, Hotel Site Plans, Park Site Plans, for developing the residential and commercial landscape design drawings and site plan, parks planning, landscaping territories, lighting trails, for creating drainage facilities, yard layouts, plant maps, outdoor recreational facilities, and irrigation systems plans.

Tree Network Topology Diagram

The Tree Network Topology Diagram examples was created using ConceptDraw DIAGRAM software with Computer and Networks solution.

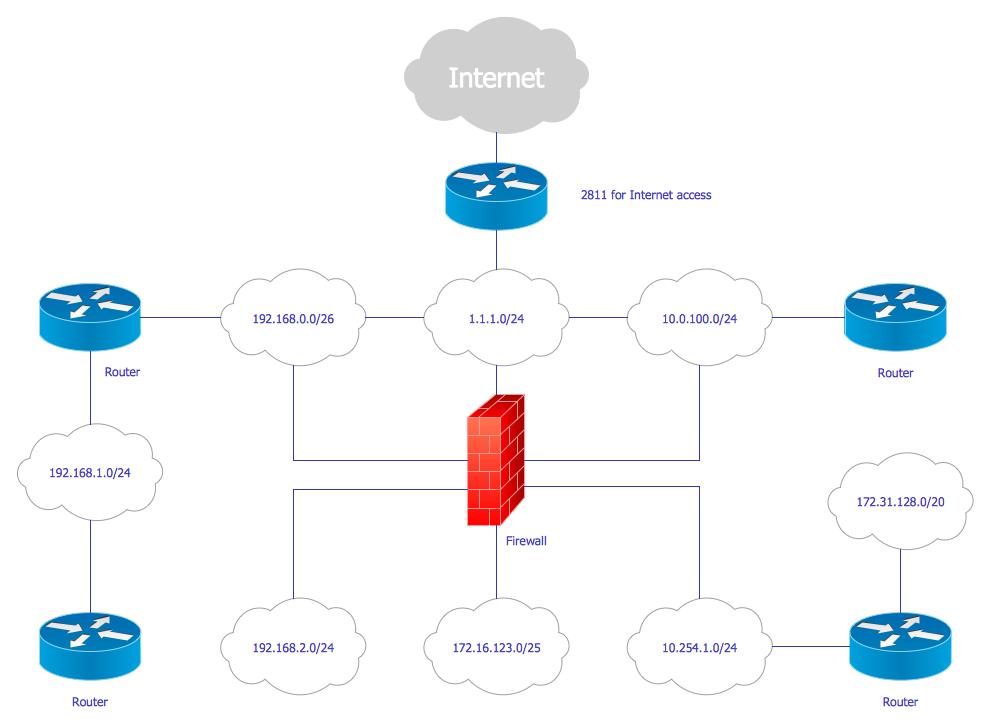
Cisco Network Design

ConceptDraw has Cisco network diagram templates and examples for designing:

Cisco Express Forwarding Sample,
Cisco ISG Topology Diagram,
Roaming Wireless Local Area Network,
Network Organization Chart,
Wireless Mesh Network,
etc.

You can use built-in Cisco symbols to customize samples or design Cisco network diagrams, presented in 13 Libraries like this: Cisco Basic, Cisco Buildings, Cisco IBM, Cisco LAN, Cisco WAN, Cisco Media, Cisco Optical, Cisco People, Cisco Routers, Cisco Security, Cisco Switches&Hub, Cisco Telepresence, etc.

Management Tools — Total Quality Management

The Total Quality Management Diagram solution helps your organization visualize business and industrial processes. Create Total Quality Management diagrams for business process with ConceptDraw software.

Context Diagram Template

This template shows the Context Diagram. It was created in ConceptDraw DIAGRAM diagramming and vector drawing software using the Block Diagrams Solution from the “Diagrams” area of ConceptDraw Solution Park.
The context diagram graphically identifies the system. external factors, and relations between them. It’s a high level view of the system. The context diagrams are widely used in software engineering and systems engineering for designing the systems that process the information.