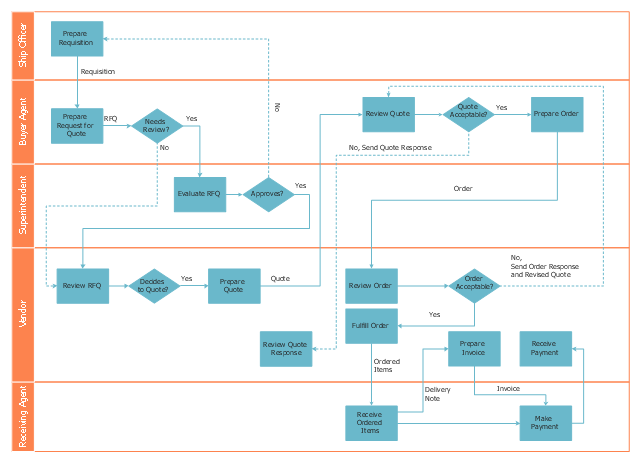
This deployment flow chart sample shows the trading process flow.
"Trade, also called goods exchange economy, is to transfer the ownership of goods from one person or entity to another by getting something in exchange from the buyer. Trade is sometimes loosely called commerce or financial transaction or barter. A network that allows trade is called a market. ...
Modern traders ... generally negotiate through a medium of exchange, such as money. As a result, buying can be separated from selling, or earning. ...
Retail trade consists of the sale of goods or merchandise from a very fixed location, such as a department store, boutique or kiosk, or by mail, in small or individual lots for direct consumption by the purchaser. Wholesale trade is defined as the sale of goods that are sold merchandise to retailers, to industrial, commercial, institutional, or other professional business users, or to other wholesalers and related subordinated services." [Trade. Wikipedia]
The swim lane diagram example "Deployment flowchart - Trading process diagram" was created using the ConceptDraw PRO diagramming and vector drawing software extended with the Cross-Functional Flowcharts solution from the Business Processes area of ConceptDraw Solution Park.
Swim lane diagram
UML Deployment Diagram. Diagramming Software for Design UML Diagrams


 Cross-Functional Flowcharts
The Cross-Functional Flowcharts solution extends ConceptDraw DIAGRAM software with cross functional flowchart examples, samples, and libraries of cross functional flow chart vector design elements and CH-1 symbols for easy drawing professional-looking and illustrative Cross Functional Flowchart, Cross Functional Diagram, CH-1 Diagram, Process Flowchart, Deployment Flowchart, Opportunity Flowchart, Swimlane Process Mapping Diagram, or Visio Cross Functional Flowchart for planning and further analyzing, optimizing and improvement processes. The use of included pre-made cross functional flowchart template, opportunity flowchart template, and swimlane process map template, greatly easier designing your Cross-functional flowcharts.
Build a Flowchart Quickly With AutoConnect

UML Deployment Diagram. Design Elements

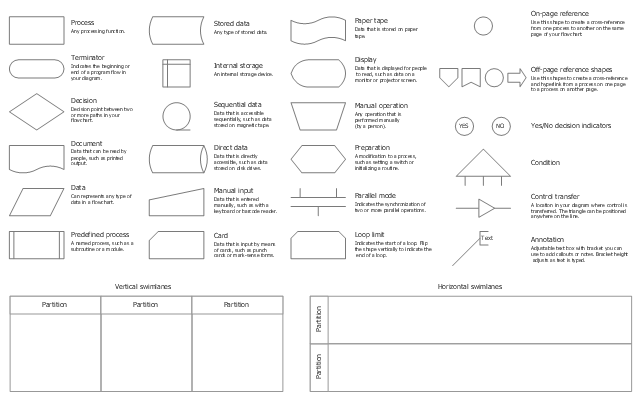
The vector stencils library "Cross-functional flowcharts" contains 31 symbols for creating the deployment flow charts using the ConceptDraw PRO diagramming and vector drawing software.
"A deployment flowchart (sometimes referred to as a "cross functional flowchart") is a business process mapping tool used to articulate the steps and stakeholders of a given process. ...
As deployment flowcharts highlight the relationships between stakeholders in addition to the process flow they are especially useful in highlighting areas of inefficiency, duplication or unnecessary processing. Often utilized within Six sigma activity, completed flowcharts are commonly used to examine the interfaces between “participants” which are typically causes for delays and other associated issues. Deployment flowcharts are useful for determining who within an organization is required to implement a process and are sometimes used as a business planning tool." [Deployment flowchart. Wikipedia]
The example "Design elements - Cross-functional flowcharts" is included in the Cross-Functional Flowcharts solution from the Business Processes area of ConceptDraw Solution Park.
Cross-functional flowchart shapes
Types of Flowcharts


QFD | Quality Function Deployment Diagram

 Business Process Mapping
The Business Process Mapping solution has a collection of vector graphic libraries, pre-made templates, and examples of the business process maps. They are useful for many business specialists including economists, politicians, analysts, and other economic experts, officials and state managers for making the unique and professionally looking drawings. Use it to create an effective Business process map, SIPOC diagram, Swim lanes flowchart and clearly define the necessary business processes due to their inputs and outputs.
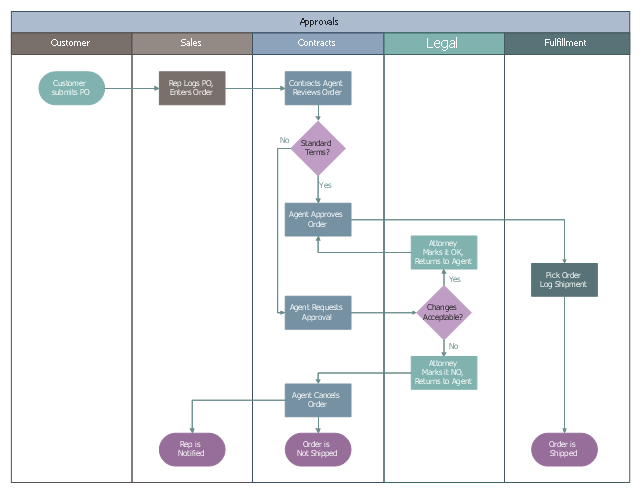
This cross-functional (deployment) flowchart example was redesigned from the Wikimedia Commons file: Approvals.svg.
[commons.wikimedia.org/ wiki/ File:Approvals.svg]
This file is made available under the Creative Commons CC0 1.0 Universal Public Domain Dedication. [creativecommons.org/ publicdomain/ zero/ 1.0/ deed.en]
"The swim lane flowchart differs from other flowcharts in that processes and decisions are grouped visually by placing them in lanes. Parallel lines divide the chart into lanes, with one lane for each person, group or subprocess. Lanes are labelled to show how the chart is organized." [Swim lane. Wikipedia]
The swimlane diagram example "Business process swim lane flowchart - Approvals" was drawn using the ConceptDraw PRO diagramming and business graphics software extended with the Business Process Mapping solution from the Business Processes area of ConceptDraw Solution Park.
Cross-functional flowchart
Cross-Functional Flowchart


Cross Functional Flowchart

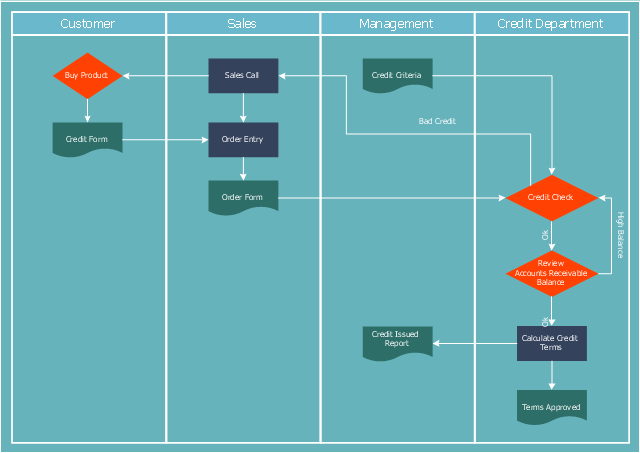
"Credit (from Latin credo translation. "I believe" ) is the trust which allows one party to provide resources to another party where that second party does not reimburse the first party immediately (thereby generating a debt), but instead arranges either to repay or return those resources (or other materials of equal value) at a later date. The resources provided may be financial (e.g. granting a loan), or they may consist of goods or services (e.g. consumer credit). Credit encompasses any form of deferred payment. Credit is extended by a creditor, also known as a lender, to a debtor, also known as a borrower." [Credit (finance). Wikipedia]
The cross-functional (deployment) flowchart example "Credit approval process" was created using the ConceptDraw PRO diagramming and vector drawing software extended with the Cross-Functional Flowcharts solution from the Business Processes area of ConceptDraw Solution Park.
The cross-functional (deployment) flowchart example "Credit approval process" was created using the ConceptDraw PRO diagramming and vector drawing software extended with the Cross-Functional Flowcharts solution from the Business Processes area of ConceptDraw Solution Park.
Credit approval process flowchart
Business Process Flowchart

Create a Cross-Functional Flowchart

The Sales Process

Linux Audit Flowchart Example. Flowchart Examples

Powerful Drawing Feature for Creating Professional Diagrams

Software and Database Design with ConceptDraw DIAGRAM

UML Deployment Diagram

- Cross-Functional Flowchart | Types of Flowcharts | Cross-Functional ...
- Trading process diagram - Deployment flowchart | Cross-Functional ...
- Trading process diagram - Deployment flowchart | Cross-Functional ...
- Cross-Functional Flowchart | Deployment Flowchart Template
- Trading process diagram - Deployment flowchart | Trading process ...
- Deployment flowchart - Trading process diagram | Vertical Cross ...
- Purchasing flowchart | Trading process diagram - Deployment ...
- Flow Chart Creator | Trading process diagram - Deployment ...
- Matrices | Deployment Or Matrix Flow Chart Example
- Trading process diagram - Deployment flowchart | UML Component ...