HelpDesk
How to Create SWOT Analysis Template Using ConceptDraw PRO
SWOT-analysis is used to develop a marketing strategy. SWOT-analysis includes determining the strengths and weaknesses in the company's activity, potential external threats and opportunities and assesses their relative strategic competitors. ConceptDraw SWOT and TOWS Matrix Diagrams solution provide a set of SWOT matrix in which should be recorded and then compared the strengths and weaknesses of the enterprise and the market opportunities and threats. This comparison allows you to determine what steps can be taken for the development of your company and what problems need to be addressed urgently.HelpDesk
How to Draw an Organizational Chart Using ConceptDraw PRO
The organizational chart software is a valuable tool for modern business. It is important for any business to build a clear organizational structure that determines the responsibilities and relationships between different positions in the organization. The clear structured organization - means the clear structured business workflow, which is the core of success in the business. ConceptDraw PRO is an org chart software that allows you to draw an organizational structure of your company quickly and easily.HelpDesk
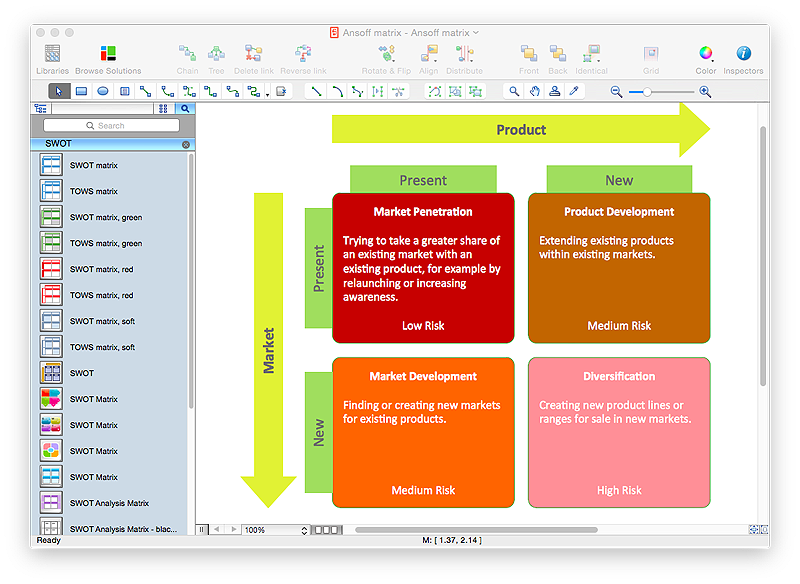
How to Make an Ansoff Matrix Template in ConceptDraw PRO
Ansoff Matrix is a business strategic management tool that helps a business determine its product and market growth strategy. Ansoff matrix has four sections to show each impacting ways that businesses can grow. Using Ansoff Matrix enables determining the current position of any business in the industry and choose the direction of its growth, which would provide the most competitive position. While Ansoff Matrix is most commonly used as a business planning tool it can be used also for personal development. You can make Ansoff Matrix template for your organization using ConceptDraw PRO Matrices solution.HelpDesk
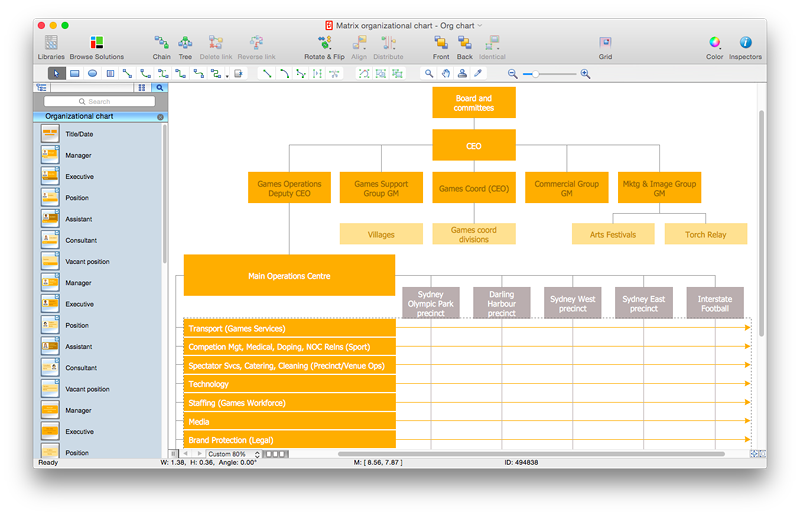
How to Draw a Matrix Organizational Chart with ConceptDraw PRO
There are a number of moments which are influenced on how the organizational structure of a certain business needs to be, how complex, and which type it should keep. The matrix organizational structure is atypical because it brings together employees and managers from different departments to work toward accomplishing a goal. This structure is commonly found in businesses that have more than one line of reportage. For instance, a company might contain an engineering department with engineering managers who workers report to. However, these workers might also have to liaise with different product or project managers depending on current tasks. Some form of matrix organization is found in most large-scale modern businesses. It is one of the most complicated reporting structures. You can easily build a clear matrix organizational chart in ConceptDraw PRO using templates from ConceptDraw Solution Park.HelpDesk
How to Create a Fishbone (Ishikawa) Diagram Quickly
A Fishbone (Ishikawa) diagram is also called cause-and-effect diagram. Fishbone diagram is often used in business to determine the cause of some problem. The diagram illustrates the main causes and sub-causes leading to an event. The main goal of the Fishbone diagram is to illustrate in a graphical way the relationship between a given outcome and all the factors that influence this outcome. The complete diagram resembles a fish skeleton as its name implies. The ability to create a Fishbone Diagram is supported by the Fishbone Diagram solution. Use ConceptDraw MINDMAP for structuring data and then ConceptDraw PRO for generating a Fishbone Diagram from mind map structure.HelpDesk
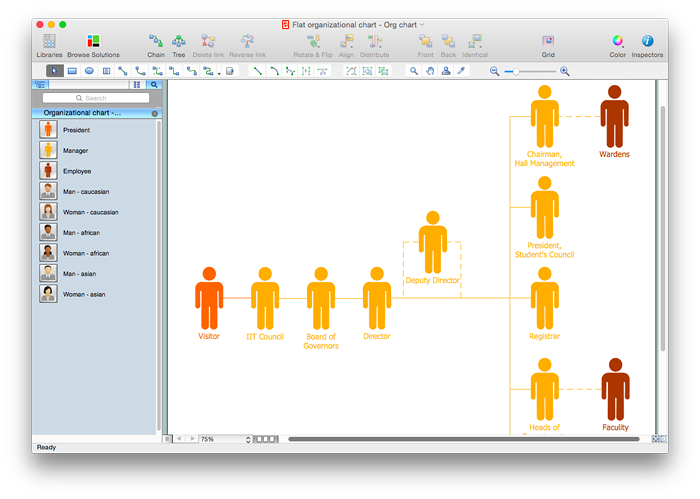
How to Draw a Flat Organizational Chart with ConceptDraw PRO
A clear organizational chart helps you to understand the relationships of positions in an organization in terms of authority and responsibility. A Flat organizational structure is one of the most typical organizational structure. Use The Flat Organizational chart template to draw an organizational structure of your company. ConceptDraw 25 Typical Orgcharts solution provides you with the possibility to develop typical organizational charts quickly and easily.
 Management
This solution extends ConceptDraw PRO v9 and ConceptDraw MINDMAP v7 with Management Diagrams and Mind Maps (decision making, scheduling, thinking ideas, problem solving, business planning, company organizing, SWOT analysis, preparing and holding meetings
HelpDesk
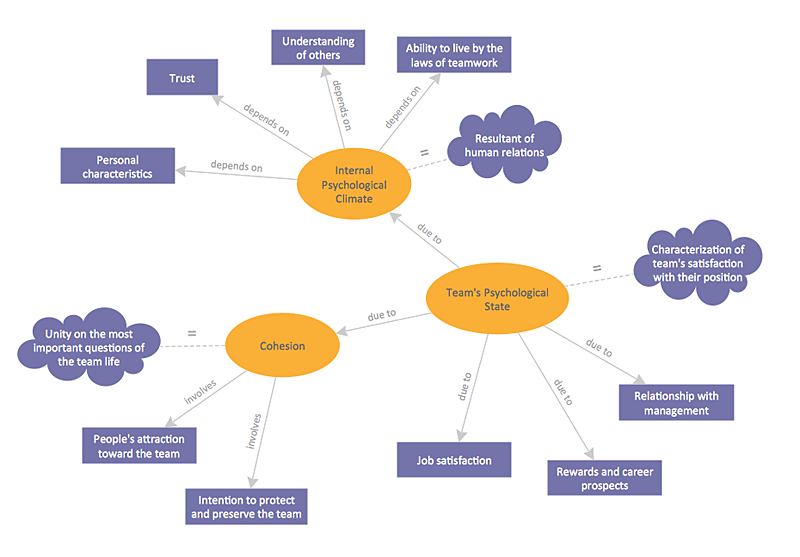
How to Create a Concept Map in ConceptDraw PRO
Graphical technique of knowledge representation in a form of structured networks of concepts (ideas) is called concept mapping. Concept network consists of shapes that represent concepts and connectors representing relationships between concepts. The difference between mind maps and concept maps is that a mind map has only one object depicting a main idea , while a concept map may have several. Concept mapping is used to structure ideas, to communicate complex system of knowledge, to help learning process, etc. ConceptDraw PRO allows you to draw concept maps using the Concept Map solution.Best Value Stream Mapping mac Software
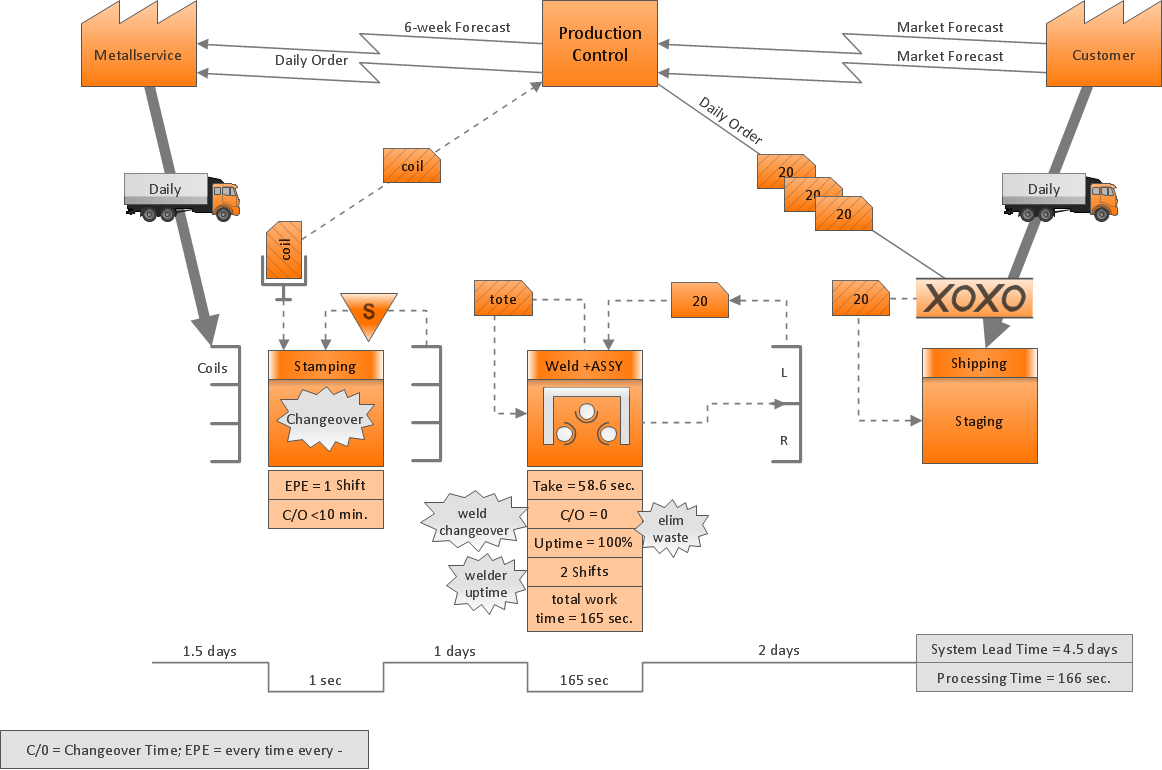
Create value stream maps - for value stream analysis and value stream management, material and information flow mapping, using our quick start templates included with ConceptDraw.
 Quality Mind Map
This solution extends ConceptDraw MINDMAP software with Quality Management Mind Maps (Presentations, Meeting Agendas, Problem to be solved).
HelpDesk
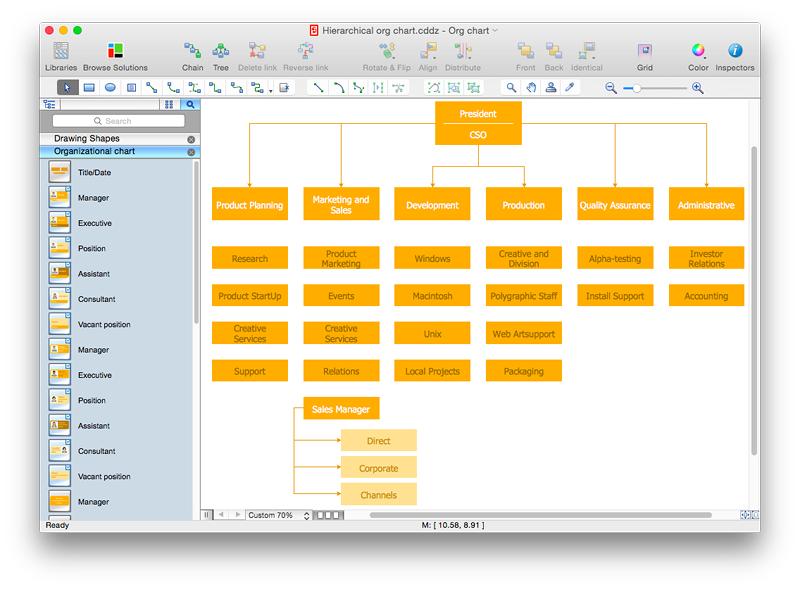
How to Draw a Hierarchical Organizational Chart with ConceptDraw PRO
There are a number of different organisational structures. The most appropriate structure will depend on the size of the business and the type of business. A hierarchical organizational structure is one of the most typical organizational structure. This structure can be represented as a pyramid, with a single entity in authority at the top, with subsequent levels of power beneath them. Each member of the pyramid reports only to their direct subordinates or superiors, limiting the amount of communication overhead, which can be seen both as an asset or a limitation. It is easy to see where a hierarchical structure would be an effective solution; companies that have offices based in disparate locations, a business that focuses on diversified markets, any organization with need for multiple levels of middle management. You can easily create a clear hierarchical organizational chart using ConceptDraw solution that contains templates of the 25 Typical Orgcharts.HelpDesk
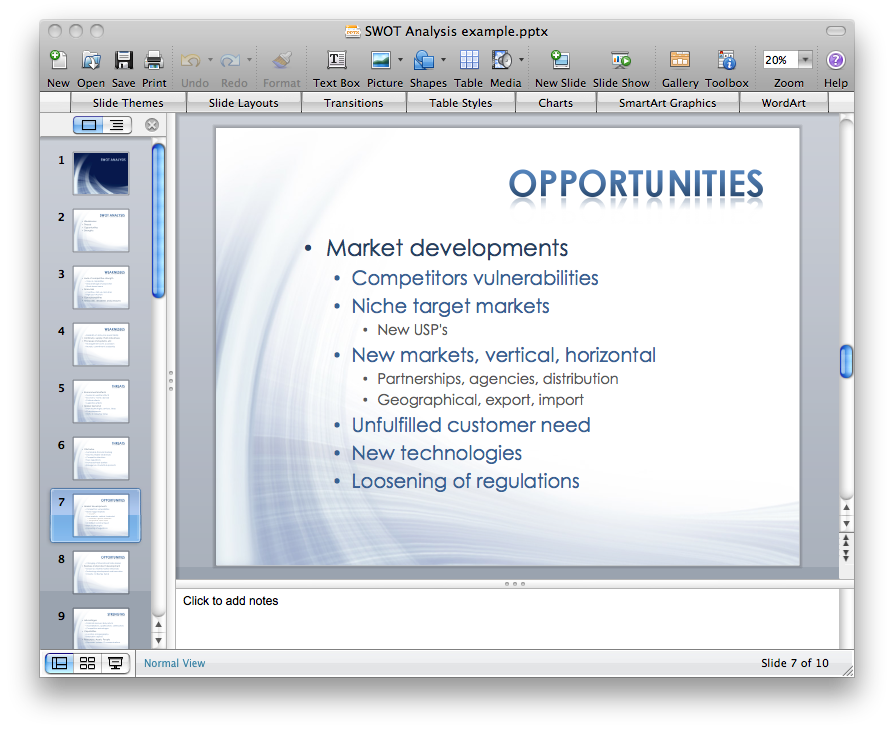
How to Create a PowerPoint Presentation from a SWOT Matrix
You can use SWOT analysis PowerPoint presentation to represent strengths, weakness, opportunities, and threats involved in your SWOT matrix.HelpDesk
How to Draw a Fishbone Diagram with ConceptDraw PRO
Fishbone (Ishikawa) Diagram is often used in business to determine the cause of some problem. A Fishbone diagram is also called cause-and-effect diagram.The main goal of the Fishbone diagram is to illustrate in a graphical way the relationship between a given outcome and all the factors that influence this outcome. The complete diagram resembles a fish skeleton as its name implies. Cause and Effect analysis is used in management to identify the possible causes of a problem in order to eliminate them. The ability to create a Fishbone Diagram is supported by the Fishbone Diagram solution.- Mind Map Template Ppt
- Swot Infographics Free Downloads
- Marketing Plan Infographic | How to Create a Powerful Infographic ...
- Flowchart Software | SWOT analysis matrix diagram templates ...
- How to Create Management Infographics Using ConceptDraw PRO ...
- Bubble Map Maker | How to draw Metro Map style infographics ...
- Directional Maps | How to Create a Directional Map Using ...
- Spatial infographics Design Elements: Continental Map | How to ...
- Best Mind Mapping Program for Making Presentations | Best Value ...
- Mind Map Making Software | Best Mind Mapping Program for ...
- How to draw Metro Map style infographics ? (London) | How to draw ...
- How to Create Management Infographics Using ConceptDraw PRO ...
- New Year card Snowman - Template | Holiday | How to draw Metro ...
- Marketing Map Template
- Mind Map Making Software | Best Mind Mapping Program for ...
- Mind Map Exchange | Management | Note Exchange | Maps P
- Marketing Plan Infographic | Social Media Marketing Infographic ...
- Examples of Infographics | Brilliant Examples of Infographics Map ...
- Decision Making Software For Small Business | Presentation Clipart ...


