Flow Chart Creator

Influence Diagram Software

Network Diagram Software IVR Balance Recharge Diagram


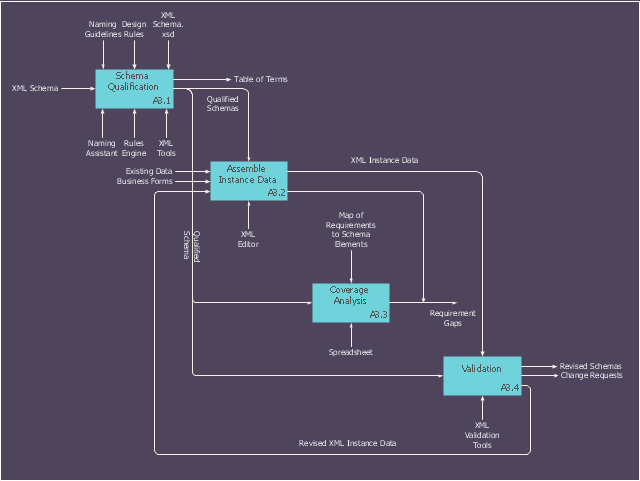
This IDEF0 diagram sample was created on the base of the figure from the website of the Engineering Laboratory of the National Institute of Standards and Technology (NIST). [mel.nist.gov/ msidlibrary/ doc/ kc_ morris/ gsa-final_ files/ image011.gif]
"Verification and Validation of Computer Simulation Models is conducted during the development of a simulation model with the ultimate goal of producing an accurate and credible model.
"Simulation models are increasingly being used to solve problems and to aid in decision-making. The developers and users of these models, the decision makers using information obtained from the results of these models, and the individuals affected by decisions based on such models are all rightly concerned with whether a model and its results are “correct”". This concern is addressed through verification and validation of the simulation model.
Simulation models are approximate imitations of real-world systems and they never exactly imitate the real-world system. Due to that, a model should be verified and validated to the degree needed for the models intended purpose or application.
The verification and validation of simulation model starts after functional specifications have been documented and initial model development has been completed. Verification and validation is an iterative process that takes place throughout the development of a model." [Verification and Validation of Computer Simulation Models. Wikipedia]
The IDEF0 diagram example "Model validation" was created using the ConceptDraw PRO diagramming and vector drawing software extended with the IDEF0 Diagrams solution from the Software Development area of ConceptDraw Solution Park.
IDEF0 diagram
Drawing Illustration

How to Draw Pictorial Chart. How to Use Infograms

Pyramid Diagram and Pyramid Chart

Flowchart Components

"Ecosystems represent sources of natural capital and provide goods and services to society, also called ecosystem services. The Millennium Ecosystem Assessment identified over 24 ecosystem services that can be divided up into 4 general groups including: 1) provisioning, 2) supporting, 3) regulating and 4) cultural." [User:Sawtoothgirl/ Sustainable Real Estate Development. Wikipedia]
"Humankind benefits in a multitude of ways from ecosystems. Collectively, these benefits are known as ecosystem services. Ecosystem services are regularly involved in the provisioning of clean drinking water and the decomposition of wastes. While scientists and environmentalists have discussed ecosystem services implicitly for decades, these the ecosystem services concept itself was popularized by the Millennium Ecosystem Assessment (MA) in the early 2000s. This grouped ecosystem services into four broad categories: provisioning, such as the production of food and water; regulating, such as the control of climate and disease; supporting, such as nutrient cycles and crop pollination; and cultural, such as spiritual and recreational benefits. To help inform decision-makers, many ecosystem services are being assigned economic values." [Ecosystem services. Wikipedia]
The segmented pyramid diagram example "Ecosystem goods and services" was redesigned using the ConceptDraw PRO diagramming and vector drawing software from Wikimedia Commons file ES_ triangle.png.
[commons.wikimedia.org/ wiki/ File:ES_ triangle.png]
This file is licensed under the Creative Commons Attribution-Share Alike 3.0 Unported license. [creativecommons.org/ licenses/ by-sa/ 3.0/ deed.en]
This segmented pyramid diagram example "Ecosystem goods and services" is included in the Pyramid Diagrams solution from the Marketing area of ConceptDraw Solution Park.
Pyramid diagram

Process Flowchart


How To Make the Right Decision in Projects


This arrow loop diagram sample was created on the base of the figure illustrating the article "Up Close and Personal. Life as an Intelligence Analyst" from the FBI website. [fbi.gov/ news/ stories/ 2006/ may/ arias050506]
"The traditional Intelligence cycle is the fundamental cycle of intelligence processing in a civilian or military intelligence agency or in law enforcement as a closed path consisting of repeating nodes. The stages of the intelligence cycle include the issuance of requirements by decision makers, collection, processing, analysis, and publication of intelligence. The circuit is completed when decision makers provide feedback and revised requirements. The intelligence cycle is also called the Intelligence Process by the U.S. Department of Defense (DoD) and the uniformed services." [Intelligence cycle. Wikipedia]
The arrow loop diagram example "Intelligence analyst cycle" was created using the ConceptDraw PRO diagramming and vector drawing software extended with the Target and Circular Diagrams solution from the Marketing area of ConceptDraw Solution Park.
www.conceptdraw.com/ solution-park/ marketing-target-and-circular-diagrams
Arrow loop diagram
Onion Diagram Maker

- Decision Maker Icons
- Decision Making | Workflow Diagram | Block diagram - Customer ...
- Financial Managerial Accounting For Decision Makers Pdf
- Decision Diagram
- Influence Diagram Software | Influence Diagram | Marketing Charts ...
- Decision Flow Diagram
- Bar Diagrams for Problem Solving. Create business management ...
- Decision Making Software For Small Business | Influence Diagram ...
- Decision Making | Fault Tree Diagram | Influence Diagram | Decision ...
- Decision Diagram Template
- Influence Diagram Software | Decision Making | CORRECTIVE ...
- Organization Chart Software | Influence Diagram Software | Cause ...
- Chemistry Lab Diagram Maker
- Intelligence analyst cycle - Arrow loop diagram | Target and Circular ...
- Illustrate The Intelligence Process By Using A Diagram
- Intelligence analyst cycle - Arrow loop diagram
- LLNL Flow Charts | Best Program to Make Flow Chart Diagrams ...
- With The Aid Of Diagram What Is Decision Making Process
- Intelligence analyst cycle - Arrow loop diagram | Block diagram ...
- Onion Diagram Maker | Program Evaluation and Review Technique ...