This sales performance dashboard example includes KPIs indicators and business metrics charts: bullet indicator - "Win Ratio vs. Last Year", gauge (speedometer) indicators - "Open Deals vs. Last Year" and "YTD Sales vs. Last Year", column chart - "Leads created", line chart - "Opportunities Won", alarm indicators - "Sales Ratios", horizontal bar chart - "Top Products in Revenue".
The example "Sales performance dashboard" was created using the ConceptDraw PRO diagramming and vector drawing software extended with the Sales Dashboard solution from the Marketing area of ConceptDraw Solution Park.
www.conceptdraw.com/ solution-park/ marketing-sales-dashboard
The example "Sales performance dashboard" was created using the ConceptDraw PRO diagramming and vector drawing software extended with the Sales Dashboard solution from the Marketing area of ConceptDraw Solution Park.
www.conceptdraw.com/ solution-park/ marketing-sales-dashboard
Sales dashboard

The vector stencils library "Sales KPIs and Metrics" contains 15 chart templates and graphic indicators of sales key performance indicators (KPIs) and metrics for drawing sales dashboards: line charts "Cost per order" and "Clicks from Sales Follow-Up Emails", column charts "Social Media Usage" and "Usage Rate of Marketing Collateral", horizontal bar charts "Rate of Follow Up Contact", "Cost per customer" and "Lead Response Time", pie charts "Product mix", "Product Performance" and "Rate of Contact", gauge (speedometer) indicators "Sales Growth" and "Actual vs Plan", bullet indicator "Sales Target", diamond alarm indicators "Average Purchase Value", "Quote to Close Ratio", "Opportunity-to-Win Ratio" and "Sales Ratio".
The dashboard charts and indicators example "Design elements - Sales KPIs and metrics" for the ConceptDraw PRO diagramming and vector drawing software is included in the Sales Dashboard solution from the Marketing area of ConceptDraw Solution Park.
www.conceptdraw.com/ solution-park/ marketing-sales-dashboard
Sales dashboard charts and graphic indicators

The vector stencils library "Sales KPIs and Metrics" contains 15 chart templates and graphic indicators of sales key performance indicators (KPIs) and metrics.
Use it for drawing sales dashboards in the ConceptDraw PRO diagramming and vector drawing software extended with the Sales Dashboard solution from the Marketing area of ConceptDraw Solution Park.
Use it for drawing sales dashboards in the ConceptDraw PRO diagramming and vector drawing software extended with the Sales Dashboard solution from the Marketing area of ConceptDraw Solution Park.
Actual vs Plan

Average Purchase Value

Clicks from Sales Follow-Up Emails

Cost per customer

Cost per order

Lead Response Time

Opportunity-to-Win Ratio

Product mix

Product Performance

Rate of Contact

Rate of Follow Up Contact

Sales Growth

Sales Target

Social Media Usage

Usage Rate of Marketing Collateral

 Cross-Functional Flowcharts
Cross-functional flowcharts are powerful and useful tool for visualizing and analyzing complex business processes which requires involvement of multiple people, teams or even departments. They let clearly represent a sequence of the process steps, the order of operations, relationships between processes and responsible functional units (such as departments or positions).
 Process Flowcharts
This solution extends ConceptDraw DIAGRAM software with templates, samples, and library of vector shapes for drawing the Process Flowcharts.
Competitor Analysis

 Seven Management and Planning Tools
Seven Management and Planning Tools solution extends ConceptDraw DIAGRAM and ConceptDraw MINDMAP with features, templates, samples and libraries of vector stencils for drawing management mind maps and diagrams.
 Sales Flowcharts
The Sales Flowcharts solution lets you create and display sales process maps, sales process workflows, sales steps, the sales process, and anything else involving sales process management.
Examples of Flowcharts, Org Charts and More


Marketing Flow Chart

Business diagrams & Org Charts with ConceptDraw DIAGRAM


Sales Process Flowcharts

Sales Steps
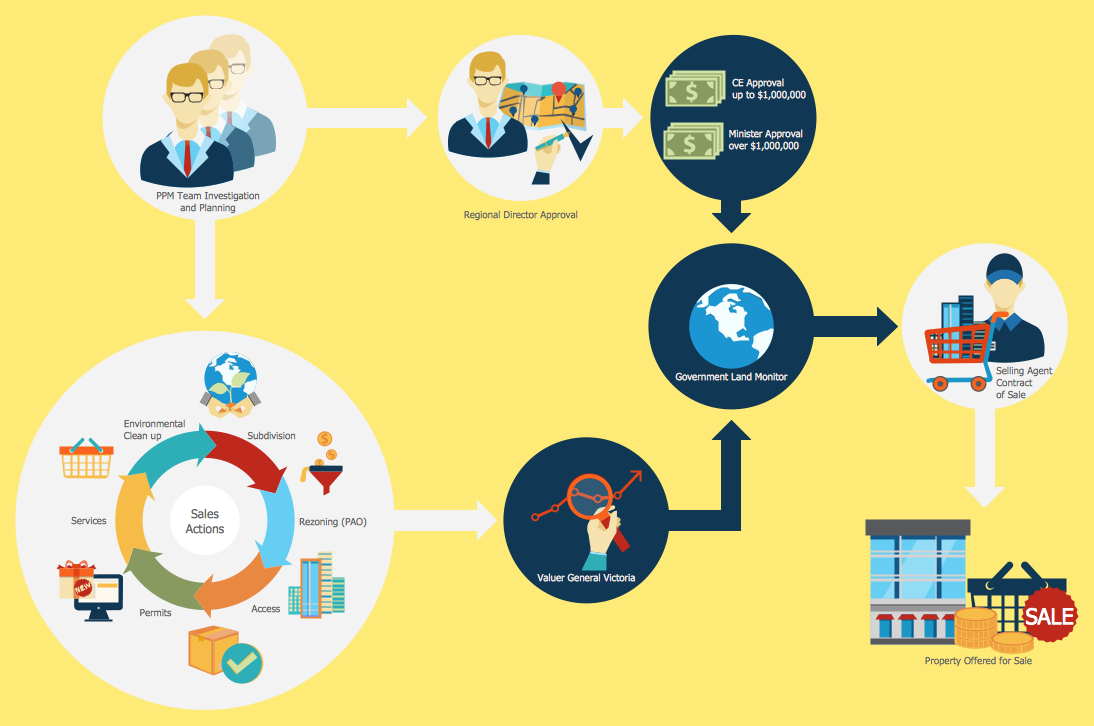
Sales Process Map

Sales Process
- Business Report Pie. Pie Chart Examples | Composition Dashboard ...
- Orders by months - Time series dashboard
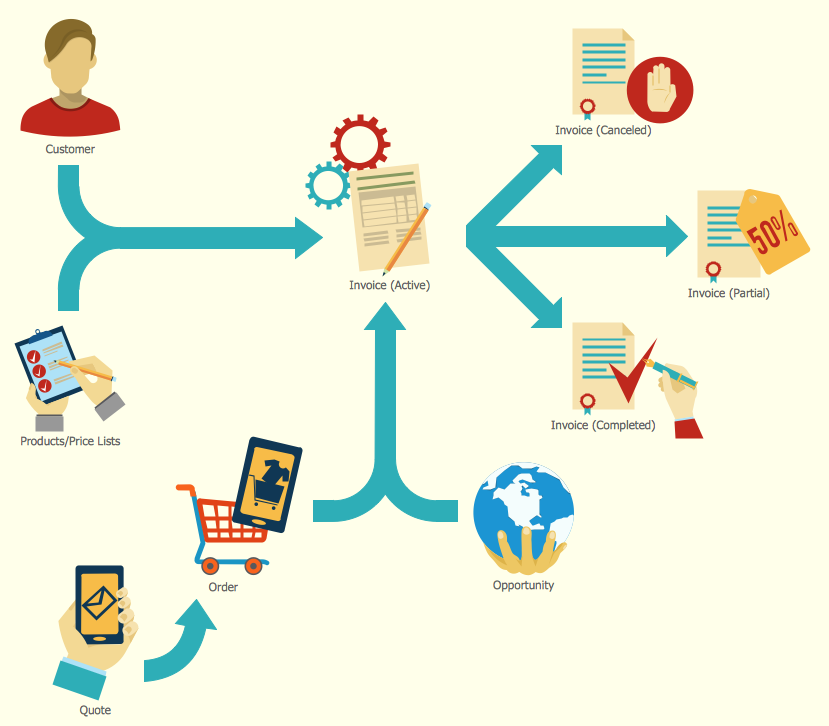
- Sales Order Status Dashboard
- Quote To Close Ratio Template Excel
- Sales Dashboard | How to Export Project Data to MS Excel ...
- Sales performance dashboard | Design elements - Sales KPIs and ...
- Performance Indicators | PM Dashboards | Design elements - Sales ...
- Sales performance dashboard | KPIs and Metrics | Design elements ...
- Sales metrics and KPIs - Visual dashboard | Sales KPIs and Metrics ...
- Take Rate Metric Dashboard
- Dashboard Follow Up
- Sales metrics and KPIs - Visual dashboard | Sales KPIs and Metrics ...
- Performance Indicators | Design elements - Sales KPIs and metrics ...
- Sales metrics and KPIs - Visual dashboard | Sales KPIs ...
- Sales Dashboards for Your Company | Sales Dashboard | Sales ...
- Sales KPIs and Metrics - Vector stencils library | Design elements ...
- Kpi Order
- Meter Dashboard | Target and Circular Diagrams | Spatial ...
- Performance dashboard
- Performance Indicators | KPI Dashboard | What is a KPI? | Key ...