HelpDesk
How to Make a Logistics Flow Chart

UML Class Diagram Example for Transport System

 Transport Hazard Pictograms
Transport Hazard Pictograms solution includes large variety of specially developed samples with transport hazard symbols and pictograms, and the whole set of predesigned vector transport GHS pictograms download and used with ease from the Transport Hazard Pictograms library. Apply them for quick designing professional-looking infographics and diagrams, use them to create warning signboards and announcements on all stages of the transportation process, to place them on the transport vehicles and warehouses of transportation companies, at the transport documentation and on the websites of transport and logistics companies.
 Aerospace and Transport
This solution extends ConceptDraw DIAGRAM software with templates, samples and library of vector clipart for drawing the Aerospace and Transport Illustrations. It contains clipart of aerospace objects and transportation vehicles, office buildings and anci
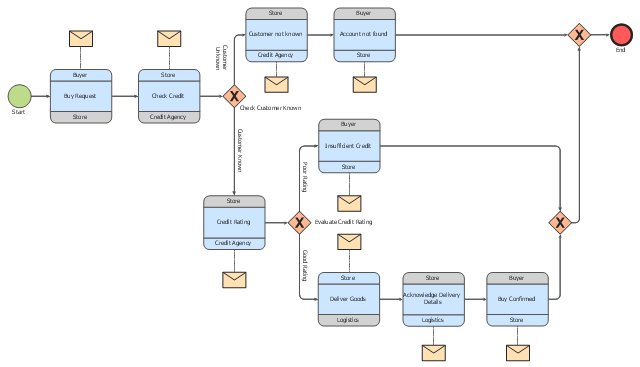
This choreography BPMN (Business Process Model and Notation) diagram sample shows the logistics workflow.
"Logistics is the management of the flow of goods between the point of origin and the point of consumption in order to meet some requirements, for example, of customers or corporations. The resources managed in logistics can include physical items, such as food, materials, animals, equipment and liquids, as well as abstract items, such as time, information, particles, and energy. The logistics of physical items usually involves the integration of information flow, material handling, production, packaging, inventory, transportation, warehousing, and often security. The complexity of logistics can be modeled, analyzed, visualized, and optimized by dedicated simulation software. The minimization of the use of resources is a common motivation in logistics for import and export." [Logistics. Wikipedia]
The business process modeling diagram example "Logistics - Choreography BPMN 2.0 diagram" was designed using the ConceptDraw PRO diagramming and vector drawing software extended with the Business Process Diagram solution from the Business Processes area of ConceptDraw Solution Park.
Business process modeling
Transportation Infographics

HelpDesk
How To Design Warning Infographics Using Transport Hazard Pictograms

 Logistics Flow Charts
Logistics Flow Charts solution extends ConceptDraw DIAGRAM functionality with opportunities of powerful logistics management software. It provides large collection of predesigned vector logistic symbols, pictograms, objects and clipart to help you design with pleasure Logistics flow chart, Logistics process flow diagram, Inventory flow chart, Warehouse flowchart, Warehouse management flow chart, Inventory control flowchart, or any other Logistics diagram. Use this solution for logistics planning, to reflect logistics activities and processes of an enterprise or firm, to depict the company's supply chains, to demonstrate the ways of enhancing the economic stability on the market, to realize logistics reforms and effective products' promotion.
Rail transport - Design elements

The vector stencils library "TQM diagrams" contains 58 TQM symbols. Use it in business process re-engineering, total quality management, continuous improvement, and quality solutions to draw cause-and-effect diagrams, top-down, and cross-functional process flow charts in the ConceptDraw PRO diagramming and vector drawing software extended with the Total Quality Management (TQM) Diagrams solution from the Quality area of ConceptDraw Solution Park.
Transportation

Inbound Goods

Storage

Procedure

Operation

Operation/ Inspection

Issue

Organization Function

2-Part Function

Decision 1 (TQM)
-tqm-diagrams---vector-stencils-library.png--diagram-flowchart-example.png)
Decision 2 (TQM)
-tqm-diagrams---vector-stencils-library.png--diagram-flowchart-example.png)
Multi in/out Decision (Multi-Input on right)
-tqm-diagrams---vector-stencils-library.png--diagram-flowchart-example.png)
Multi in/out Decision (Multi-Input on left)
-tqm-diagrams---vector-stencils-library.png--diagram-flowchart-example.png)
External Organization

External Process

Inspection/Measurement

Metric

2-part metric

System Database

System Support

System Function

Delay

Connector (TQM)
-tqm-diagrams---vector-stencils-library.png--diagram-flowchart-example.png)
Off-Page Reference

Connected Issues

Fabrication (black)
-tqm-diagrams---vector-stencils-library.png--diagram-flowchart-example.png)
Fabrication (white)
-tqm-diagrams---vector-stencils-library.png--diagram-flowchart-example.png)
Move (black)
-tqm-diagrams---vector-stencils-library.png--diagram-flowchart-example.png)
Move (white)
-tqm-diagrams---vector-stencils-library.png--diagram-flowchart-example.png)
Store (black)
-tqm-diagrams---vector-stencils-library.png--diagram-flowchart-example.png)
Store (white)
-tqm-diagrams---vector-stencils-library.png--diagram-flowchart-example.png)
Inspection (black)
-tqm-diagrams---vector-stencils-library.png--diagram-flowchart-example.png)
Inspection (white)
-tqm-diagrams---vector-stencils-library.png--diagram-flowchart-example.png)
Selectable Process (All White)
-tqm-diagrams---vector-stencils-library.png--diagram-flowchart-example.png)
Selectable Process ('Fabrication' Black)
-tqm-diagrams---vector-stencils-library.png--diagram-flowchart-example.png)
Selectable Process ('Move' Black)
-tqm-diagrams---vector-stencils-library.png--diagram-flowchart-example.png)
Selectable Process ('Store' Black)
-tqm-diagrams---vector-stencils-library.png--diagram-flowchart-example.png)
Selectable Process ('Inspection' Black)
-tqm-diagrams---vector-stencils-library.png--diagram-flowchart-example.png)
Work Flow Loop 1
Work Flow Loop 2
Feedback Arrow
X-Function - Vertical

X-Function - Horizontal

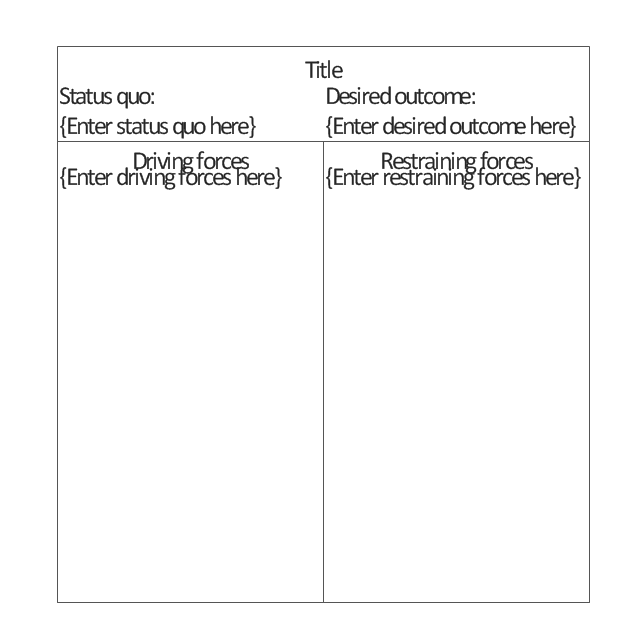
Force-Field Analysis
Cause 1
Cause 2
Cause 3
Category
Effect
Fish Frame

Dynamic Connector
Result
No Result

Branch: Return

Branch: No Return

Interrupt

External Control

Refinement

 Public Utilities
Public Utilities solution is a thematic toolset for designing infographics and diagrams about public utilities. It provides examples and premade public utility icons in vector icons libraries to develop innovative strategies for the improvement of public utility services, enhance their efficiency of delivery, and extend reliable access to services to all communities. The solution helps to public utility companies plan their activities efficiently, develop new technologies and make visual presentation, create plumbing plan, heating plan, electrical diagram, or any other technical drawing, make the overview of modern public utilities, increase utility profits, and remain the best in the market.
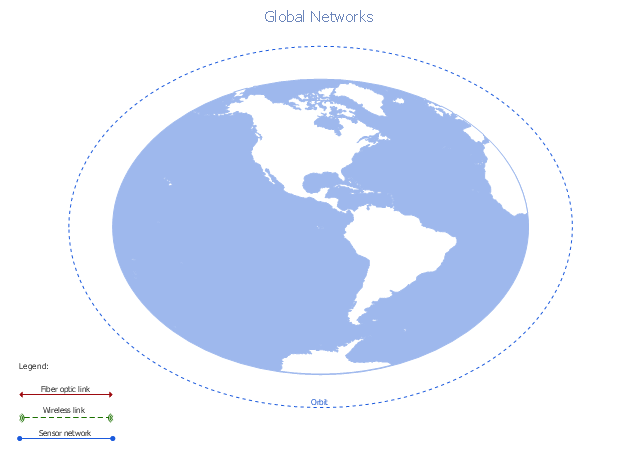
A conceptual diagram of a global vehicular network describes the principles of communication between vehicles, earth-based nodes, and space-based nodes in a wireless network. It illustrates the concept of architecture within global vehicular networks.
"Intelligent transportation systems (ITS) are advanced applications which, without embodying intelligence as such, aim to provide innovative services relating to different modes of transport and traffic management and enable various users to be better informed and make safer, more coordinated, and 'smarter' use of transport networks.
...
Intelligent transport systems vary in technologies applied, from basic management systems such as car navigation; traffic signal control systems; container management systems; variable message signs; automatic number plate recognition or speed cameras to monitor applications, such as security CCTV systems; and to more advanced applications that integrate live data and feedback from a number of other sources, such as parking guidance and information systems; weather information; bridge deicing systems; and the like." [Intelligent transportation system. Wikipedia]
The global vehicular network diagram template is included in the Vehicular Networking solution from the Computer and Networks area of ConceptDraw Solution Park.
Global vehicular network diagram template
"The Process Flow Chart provides a visual representation of the steps in a process. ...
When to Use:
One of the first activities of a process improvement effort is constructing a flowchart. It provides the following benefits:
1- It give you and everyone a clear understanding of the process.
2- Facilitates teamwork and communication.
3- Helps to identify non-value-added operations."
[bexcellence.org/ Flow-Chart.html]
This TQM diagram example shows a business process that can be then analyzed to improve the effectiveness and diagnose quality issues that require resolution.
This example was created using the ConceptDraw PRO diagramming and vector drawing software extended with the Total Quality Management (TQM) Diagrams solution from the Quality area of ConceptDraw Solution Park.
TQM diagram

This TQM diagram example was redesigned from the illustration of the Highway Performance Monitoring System (HPMS) Field Manual from the website of the Federal Highway Administration (FHWA).
[fhwa.dot.gov/ policyinformation/ hpms/ fieldmanual/ chapter7.cfm]
"Highway Performance Monitoring System (HPMS).
The HPMS is a national level highway information system that includes data on the extent, condition, performance, use and operating characteristics of the nation's highways. The HPMS contains administrative and extent of system information on all public roads, while information on other characteristics is represented in HPMS as a mix of universe and sample data for arterial and collector functional systems. Limited information on travel and paved miles is included in summary form for the lowest functional systems.
HPMS was developed in 1978 as a continuing database, replacing the special biennial condition studies that had been conducted since 1965. The HPMS has been modified several times since its inception. Changes have been made to reflect changes in the highway systems, legislation, and national priorities, to reflect new technology, and to consolidate or streamline reporting requirements." [fhwa.dot.gov/ policyinformation/ hpms.cfm]
The TQM flowchart example "Software workflow diagram" was created using the ConceptDraw PRO diagramming and vector drawing software extended with the Total Quality Management (TQM) Diagrams solution from the Quality area of ConceptDraw Solution Park.
TQM diagram

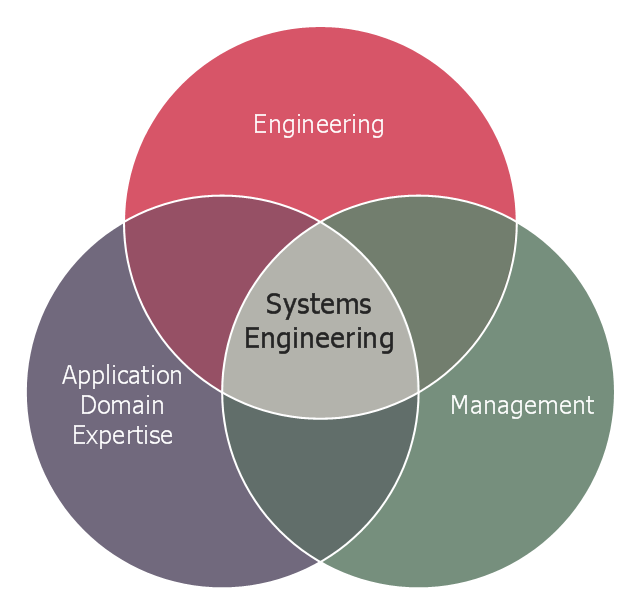
This Venn diagram sample shows the system engineering at the intersection of enginnering, management, and application domain expertise. It was designed on the base of the Venn diagram on the webpage "Intelligent Transportation Systems (ITS) ePrimer, Module 2: Systems Engineering" from the website of the Office of the Assistant Secretary for Research and Technology (OST-R), the U.S. Department of Transportation (US DOT).
"The term interdisciplinary is a fundamental concept in systems engineering. To successfully develop a system requires the application of basic engineering discipline, management discipline, and expertise in the application domain of the system. In the case of ITS, that application domain is transportation engineering. The intersection of these disciplines is the realm of systems engineering."
[pcb.its.dot.gov/ eprimer/ module2.aspx]
The Venn diagram example "Systems engineering improvement" was created using the ConceptDraw PRO diagramming and vector drawing software extended with the Venn Diagrams solution from the area "What is a Diagram" of ConceptDraw Solution Park.
Venn diagram
 Fishbone Diagrams
The Fishbone Diagrams solution extends ConceptDraw DIAGRAM software with the ability to easily draw the Fishbone Diagrams (Ishikawa Diagrams) to clearly see the cause and effect analysis and also problem solving. The vector graphic diagrams produced using this solution can be used in whitepapers, presentations, datasheets, posters, and published technical material.
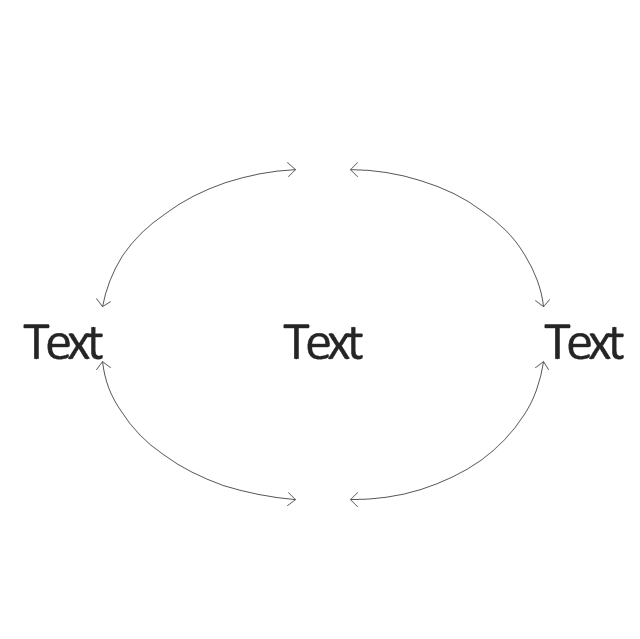
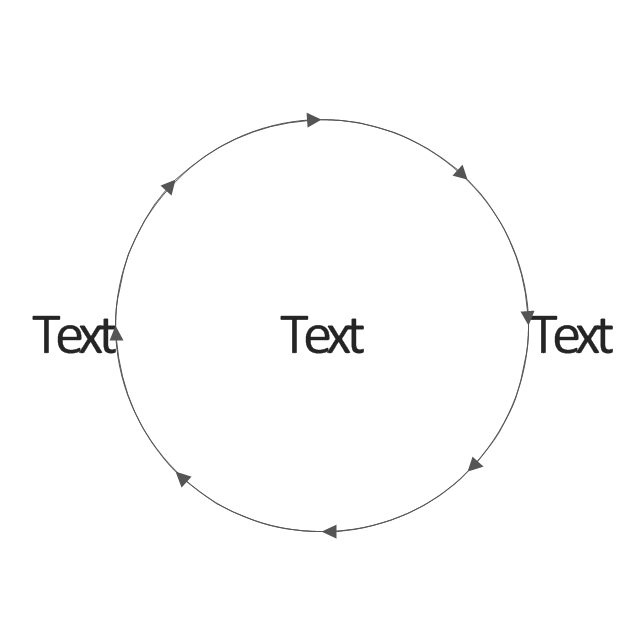
This arrow loop cycle diagram sample was created on the base of the figure illustrating the webpage "Exploratory Advanced Research Program Hand-Off Workshops" from the US Department of Transportation - Federal Highway Administration (FHWA) website. "The FHWA’s research and technology innovation life cycle illustrates that research and technology development are not insular activities, but integrated processes that together constitute a system.
Following general workshop discussion, a number of common issues emerged among the groups. These centered around the research life cycle, communicating the value of exploratory advanced research, and continued project funding. It was felt that there is a general need to better describe the research and deployment cycle specific to highway transportation and possibly to highway research fields, such as materials or system planning. Research life cycle diagrams show a very linear, chronological process but it is not necessarily that way in reality." [fhwa.dot.gov/ advancedresearch/ pubs/ 11034/ ]
The arrow loop diagram example "Innovation life cycle" was created using the ConceptDraw PRO diagramming and vector drawing software extended with the Target and Circular Diagrams solution from the Marketing area of ConceptDraw Solution Park.
www.conceptdraw.com/ solution-park/ marketing-target-and-circular-diagrams
Arrow loop cycle diagram
 Logistic Dashboard
The powerful tools of Logistic Dashboard solution and specially developed live graphic objects of logistic icons, logistic navigation elements, logistic indicators, logistic charts and logistic maps effectively assist in designing Logistic dashboards, Logistic maps, Logistic charts, diagrams and infographics. The included set of prebuilt samples and quick-start templates, demonstrates the power of ConceptDraw DIAGRAM software in logistics management, its assisting abilities in development, realization and analyzing the logistic processes, and in perfection the methods of logistics management.
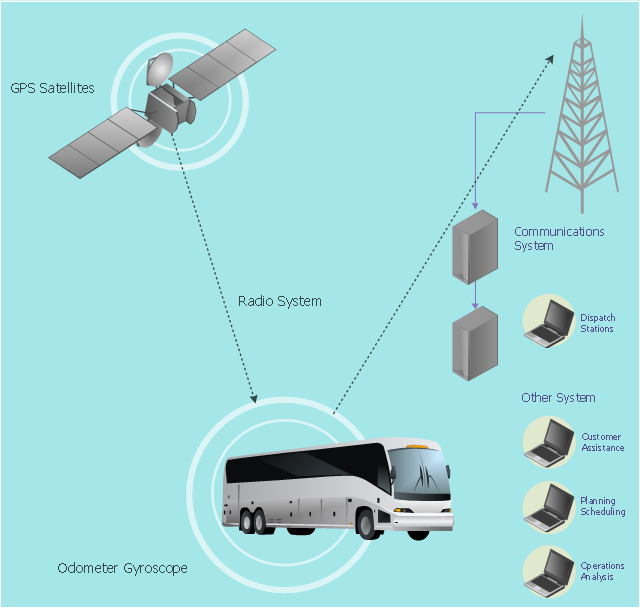
This vehicular network diagram example was drawn on the base of picture illustrating the article "Automatic Vehicle Location: Rural Transit" from the website of the Research and Innovative Technology Administration (RITA), U.S. Department of Transportation (US DOT).
"Automatic Vehicle Location (AVL) systems calculate the real-time location of any vehicle equipped with a Global Positioning Satellite (GPS) receiver. Data are then transmitted to the transit center with use of radio or cellular communications and can be used immediately for daily operations as well as archived for further analysis.
As a stand-alone technology, an AVL system can be used to monitor on-time performance. When combined with other technologies, AVL can deliver many benefits in the areas of fleet management, service planning, safety and security, traveler information, fare payment, vehicle component monitoring, and data collection. Since the greatest benefits from AVL are achieved by combining it with other Intelligent Transportation System (ITS) technologies, AVL is most appropriate for large rural agencies with more than 30 vehicles that plan to implement a comprehensive ITS."
[pcb.its.dot.gov/ factsheets/ avl/ avlRural_ overview.asp]
The vehicular network diagram example "Automatic vehicle location" was created using the ConceptDraw PRO diagramming and vector drawing software extended with the Vehicular Networking solution from the Computer and Networks area of ConceptDraw Solution Park.
Vehicular network diagram
Used Solutions
 Object-Role Modeling (ORM) Diagrams
Object-role Modeling (ORM) Diagram solution with powerful vector diagramming and data modeling tools, large quantity of specially developed samples and examples, and rich variety of vector objects corresponding to common ORM notation, ideally suits for developing the comprehensive, clear and visual Object-role Modeling (ORM) diagrams and schematics, understandable for all interested people from the different fields and business directions, for designing the ORM models, and demonstrating advantages from the use of ORM and its notation. It is intended for software developers and computer engineers, specialists in a field of Object-oriented programming (OOP), database architects, web-application constructors and developers, etc.
- UML Class Diagram Example for Transport System
- Logistics Flow Charts | Business Process Diagrams | Logistic ...
- Rail transport - Design elements | Diagram Of Rail Transportation
- UML Class Diagram Example for Transport System | UML Use Case ...
- How to Create a Vehicular Network Diagram | Transport Network
- Transit map template | Basic Network Diagram | Circuit Diagram For ...
- UML Class Diagram Example for GoodsTransportation System ...
- Computer Network Diagrams | Metro Map | Aerospace and Transport
- Road Transport | Www Transportation Network And Analysis Diagram
- AWS Architecture Diagrams | Fishbone Diagram | Computers and ...