Best Value Stream Mapping mac Software

Types of Flowcharts


VSM
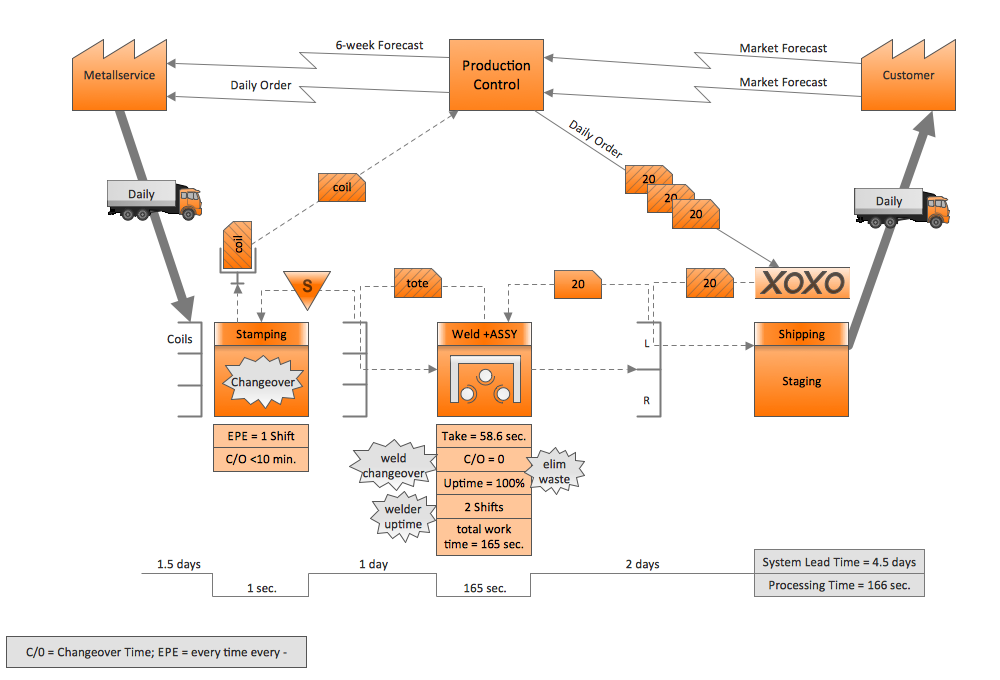
 Value Stream Mapping
Value stream mapping solution extends ConceptDraw DIAGRAM software with templates, samples and vector stencils for drawing the Value Stream Maps (VSM) in lean manufacturing practice.
Structured Systems Analysis and Design Method (SSADM) with ConceptDraw DIAGRAM

Software Diagram Examples and Templates

State Diagram Example — Online Store

Active Directory Diagram

Local area network (LAN). Computer and Network Examples
 diagram")

Value stream with ConceptDraw DIAGRAM
