Process Flowchart
The main reason of using Process Flowchart or PFD is to show relations between major parts of the system. Process Flowcharts are used in process engineering and chemical industry where there is a requirement of depicting relationships between major components only and not include minor parts. Process Flowcharts for single unit or multiple units differ in their structure and implementation. ConceptDraw PRO is Professional business process mapping software for making Process flowcharts, Process flow diagram, Workflow diagram, flowcharts and technical illustrations for business documents and also comprehensive visio for mac application. Easier define and document basic work and data flows, financial, production and quality management processes to increase efficiency of your business with ConcepDraw PRO. Business process mapping software with Flowchart Maker ConceptDraw PRO includes extensive drawing tools, rich examples and templates, process flowchart symbols and shape libraries, smart connectors that allow you create the flowcharts of complex processes, process flow diagrams, procedures and information exchange. Process Flowchart Solution is project management workflow tools which is part ConceptDraw Project marketing project management software. Drawing charts, diagrams, and network layouts has long been the monopoly of Microsoft Visio, making Mac users to struggle when needing such visio alternative like visio for mac, it requires only to view features, make a minor edit to, or print a diagram or chart. Thankfully to MS Visio alternative like ConceptDraw PRO software, this is cross-platform charting and business process management tool, now visio alternative for making sort of visio diagram is not a problem anymore however many people still name it business process visio tools.
Basic Diagramming
Block diagrams are essentially a very simple format of diagrams. A variety of commonly used shapes and connecting lines, rules of construction and actions pertaining to them, make Block diagram a versatile and flexible tool for many forms of industry. Another advantage is the ease with which Block diagrams can be constructed, especially if you use professional diagramming software. ConceptDraw PRO software is an example of purpose built application designed with the form of process modeling in mind. It includes Block Diagrams solution from Diagrams area of ConceptDraw Solution Park for easy drawing professional-looking simple diagram - Block diagram, and a lot of other useful solutions for designing variety of other types of diagrams, schematics and flowcharts (Line graphs, Bar charts, Organizational charts, Histograms, Pie charts, Process flowcharts, Fault tree analysis diagrams, Scatter plots, Venn diagrams, Bubble diagrams, etc.). The RapidDraw functionality of ConceptDraw PRO lets create new objects and their connectors in just single-click.
HelpDesk
How to Draw a Circular Arrows Diagram Using ConceptDraw PRO
The cyclic recurrence is a fundamental property of multiple systems. The cycle is a process which consists from elements (phases, stages, stages) following each other. Many processes in astronomy, biology, chemistry, physics, mathematics, etc. have a cycle properties. It is also widely used in information technologies and marketing analysis. Graphical representation of cyclic processes can have many forms. It can be a circle, parabola, hyperbola, ellipse and others. A Circular Arrows Diagram is used as one of the statistical charts in the business, mass media and marketing. ConceptDraw PRO provides its users tools for making easy drawing Circular Arrows Diagrams.HelpDesk
How to Draw a Chemical Process Flow Diagram
Process Flow Diagram widely used in modeling of processes in the chemical industry. A Chemical Process Flow diagram (PFD) is a specialized type of flowchart. With the help of Chemical Process Flow Diagram engineers can easily specify the general scheme of the processes and chemical plant equipment. Chemical Process Flow Diagram displays the real scheme of the chemical process, the relationship between the equipment and the technical characteristics of the process. Chemical Process Flow Diagram illustrates the connections between the basic equipment as well as the overall structure of pipelines and other supporting equipment. The purpose of the PFD is to build the image of the basic idea of the chemical process. ConceptDraw PRO together with its Chemical and Process Engineering solution delivers the possibility to design Chemical Process Flow diagrams. It is designed for chemical industry engineers and designers.HelpDesk
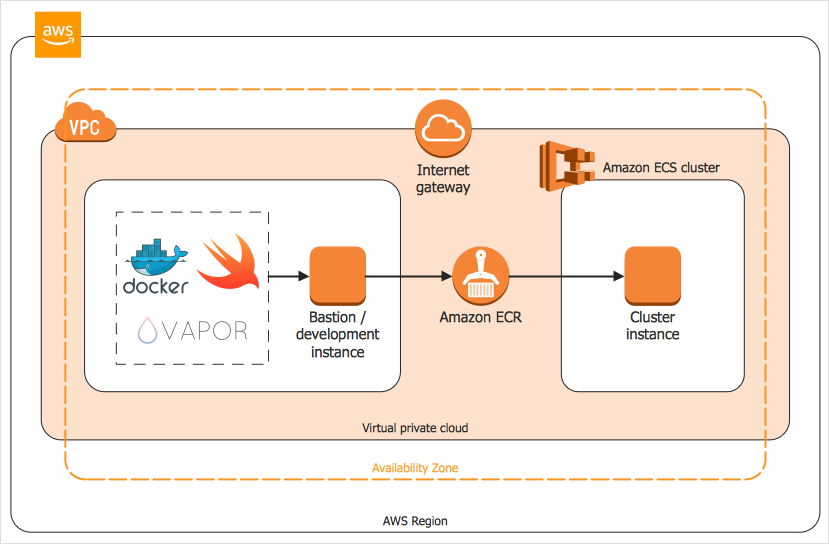
How to Create an AWS Architecture Diagram
Displaying an Amazon Web Service (AWS) cloud actually requires large amounts of attention to detail. Every element of technology has to be addressed: software, middle ware, transaction processing, scaling, data storage; the complete list is staggering. Using the ConceptDraw AWS Architecture Diagrams solution makes much easier the work on documenting the Amazon Web Service architecture. The ConceptDraw AWS Architecture Diagrams solution includes icons, sample and templates for some Amazon Web Services products and resources, to be used when buiding architecture diagrams. The icons are simple so that user can easily incorporate them in his drawings. AWS Architecture Diagrams can be used in presentations, datasheets, or any other technical visualizations.HelpDesk
How to Create a Fishbone (Ishikawa) Diagram Quickly
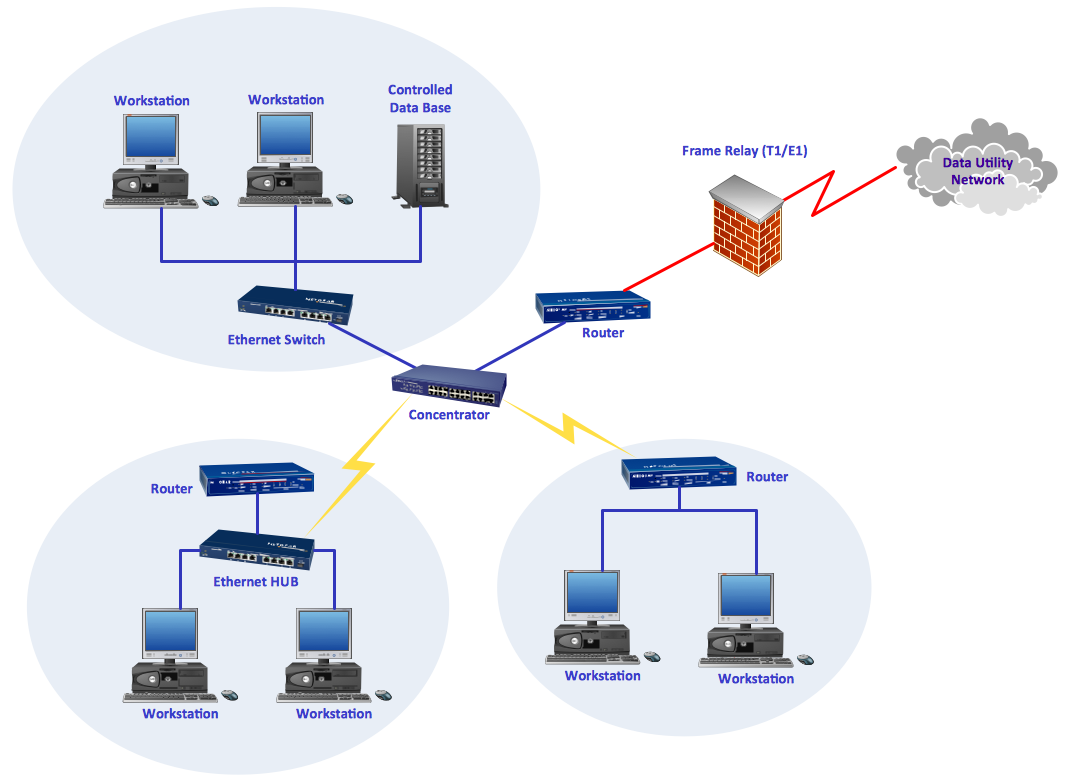
A Fishbone (Ishikawa) diagram is also called cause-and-effect diagram. Fishbone diagram is often used in business to determine the cause of some problem. The diagram illustrates the main causes and sub-causes leading to an event. The main goal of the Fishbone diagram is to illustrate in a graphical way the relationship between a given outcome and all the factors that influence this outcome. The complete diagram resembles a fish skeleton as its name implies. The ability to create a Fishbone Diagram is supported by the Fishbone Diagram solution. Use ConceptDraw MINDMAP for structuring data and then ConceptDraw PRO for generating a Fishbone Diagram from mind map structure.ConceptDraw PRO Network Diagram Tool
Computer network diagrams visually depict the nodes of computer networks and connections between them. Diversity of Network Diagrams includes Wireless network diagrams, Network wiring diagrams, LAN network diagrams, Network WAN diagrams, Network topology diagrams, Network cable diagrams, Logical network diagrams, Network security diagrams, Diagram home network, Network physical diagrams, Activity network diagrams, and many others. To construct any of them it is useful to apply a special software with effective network diagramming tools. ConceptDraw PRO is ideal and powerful network diagram tool. It helps you diagram a network or create Computer network diagrams of various types using specialized and task-specific libraries of network components such as computers, hubs, switches, servers, routers, smart connectors, printers, mainframes, face plates, etc. that simulate network architectures, network design topologies and devices (all these shapes are parts of network diagram tool ConceptDraw PRO).
HelpDesk
How to Draw a Pyramid Diagram in ConceptDraw PRO
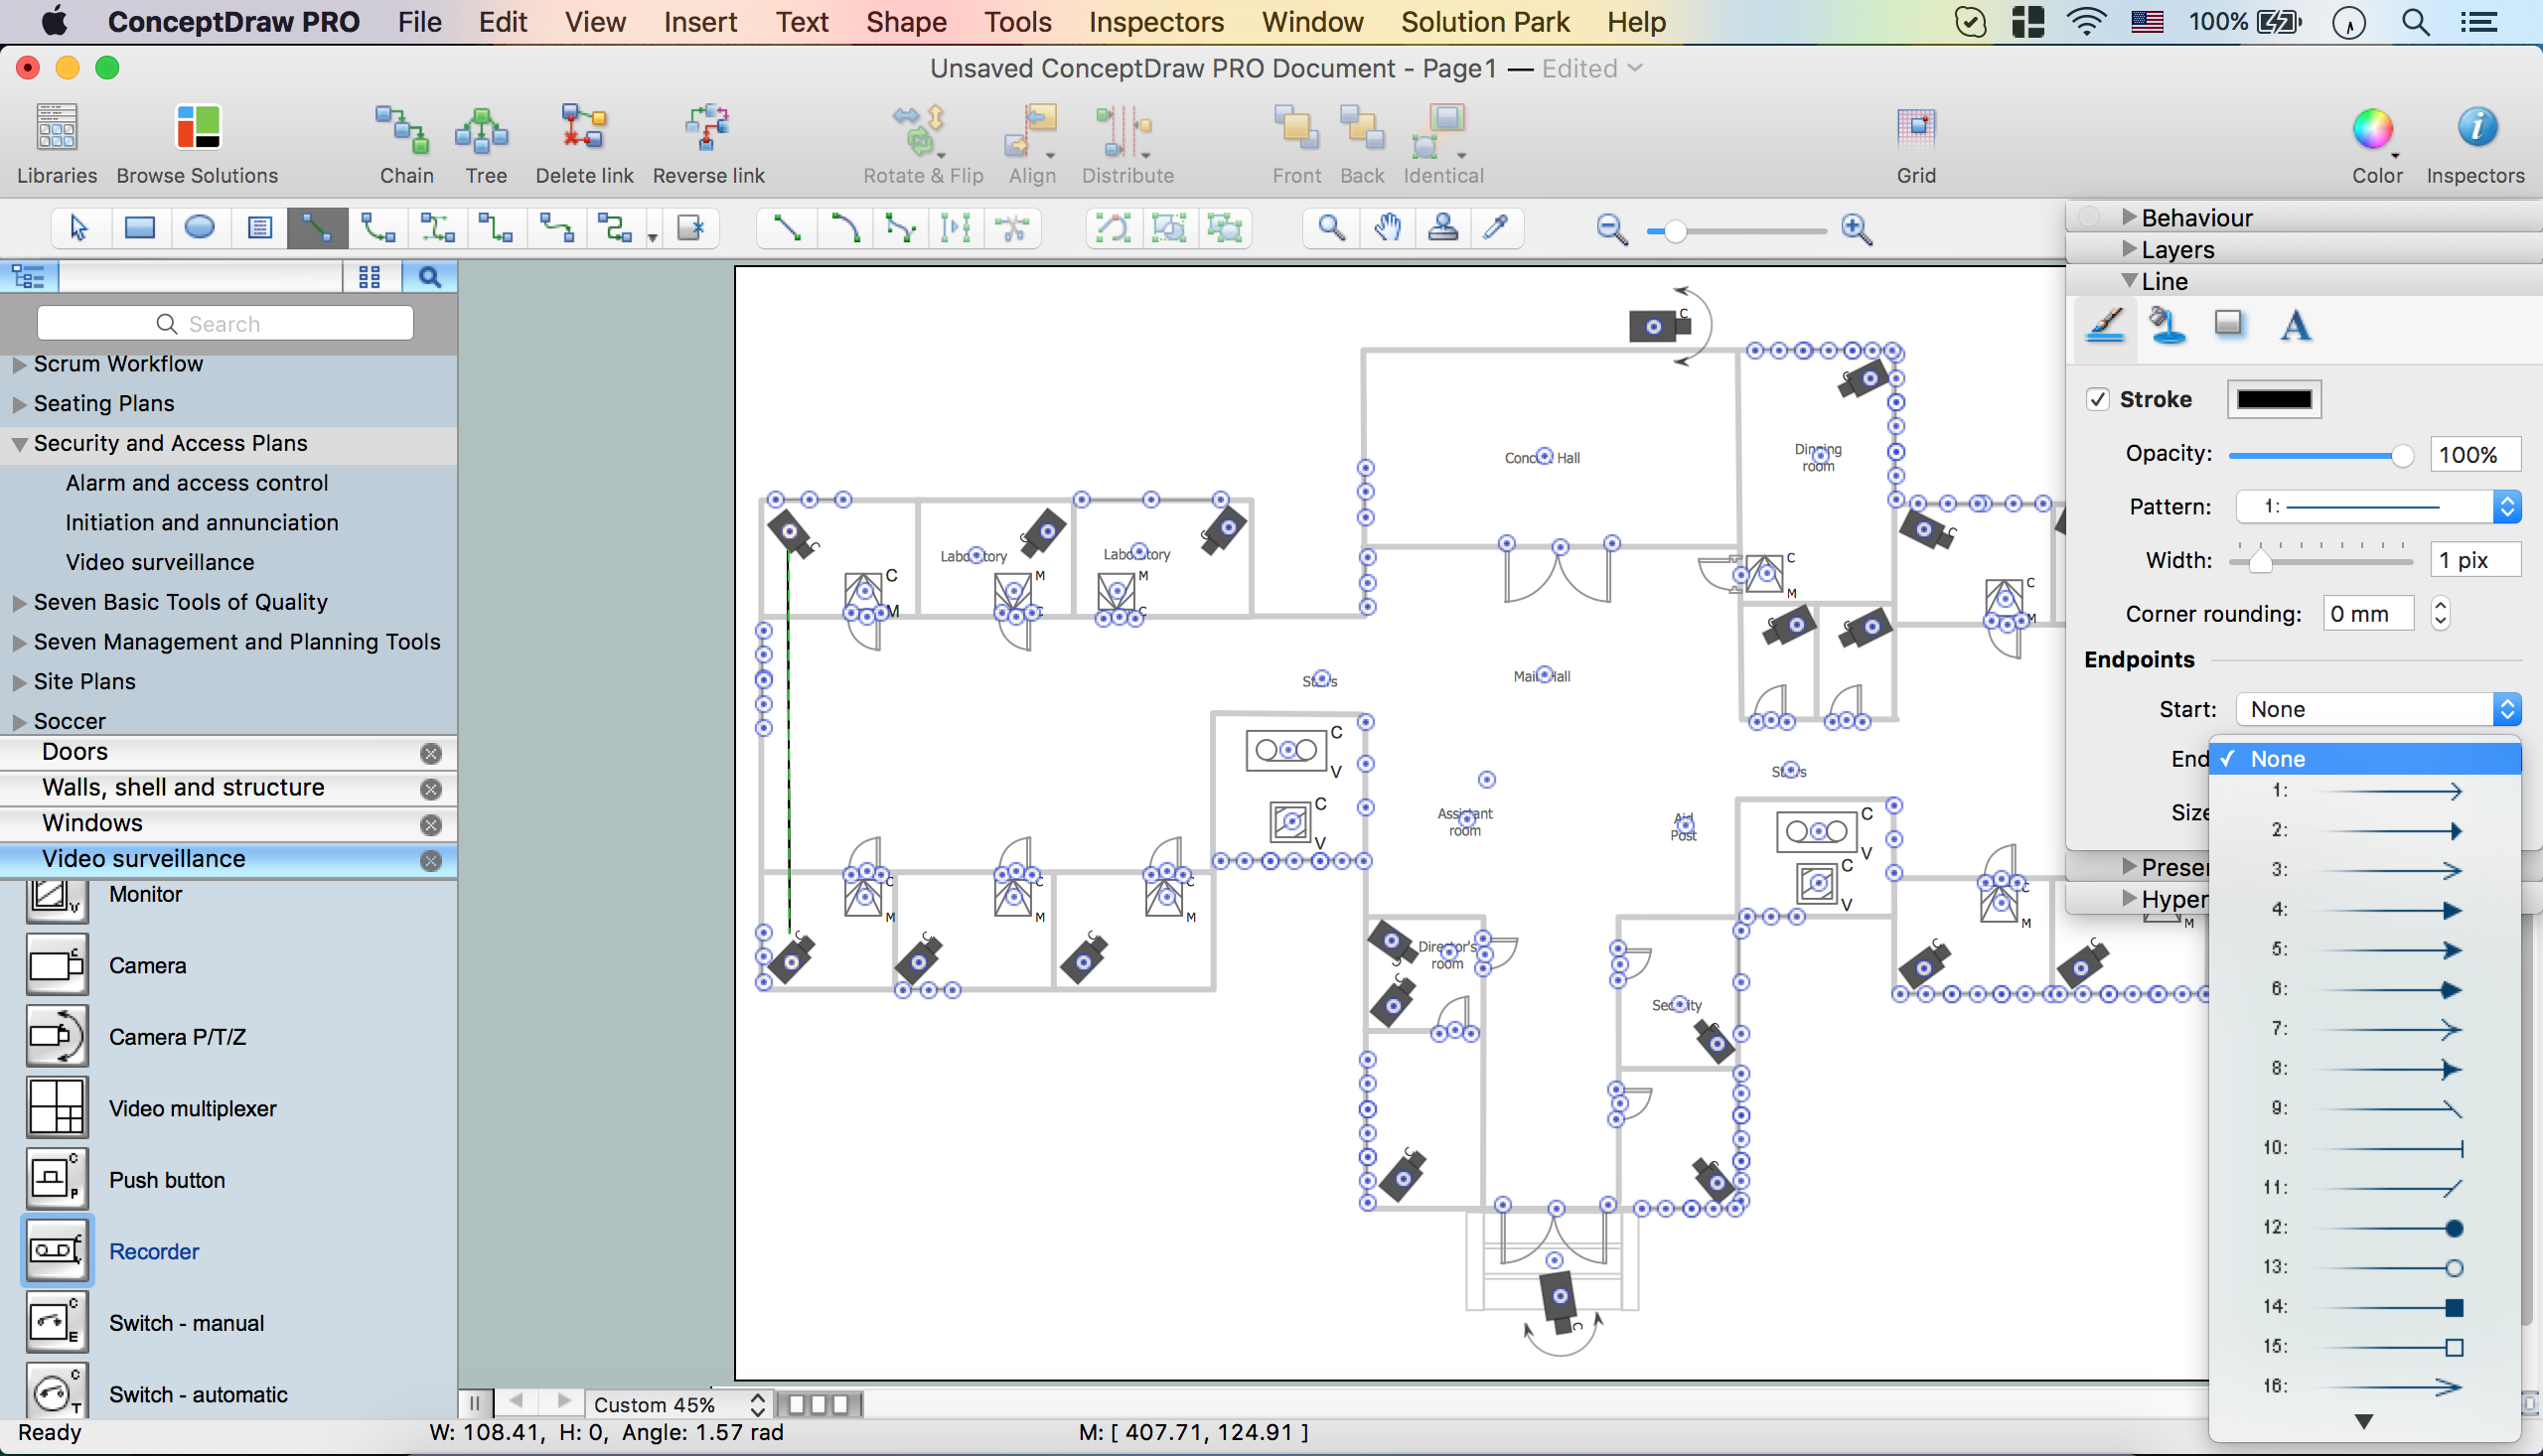
Pyramid diagram (triangle diagram) is used to represent data, which have hierarchy and basics. Due to the triangular form of diagram, each pyramid section has a different width. The width of the segment shows the level of its hierarchy. Typically, the top of the pyramid is the data that are more important than the base data. Pyramid scheme can be used to show proportional and hierarchical relationships between some logically related items, such as departments within an organization, or successive elements of any process. This type of diagram is often used in marketing to display hierarchical related data, but it can be used in a variety of situations. ConceptDraw PRO allows you to make a pyramid diagram, quickly and easily using special libraries.How To Create CCTV Network Diagram
Closed-circuit television (CCTV) uses cameras and monitors to carry out video surveillance. Unlike broadcast television this system has only local signal. It is a feature of almost every video camera, yet CCTV is mainly a system for visual control of certain areas such as banks, airports, supermarkets, and other places for security reasons. Developing and installing CCTV system is a time-consuming process. It also requires certain knowledge and skills. ConceptDraw is a solution of setting video cameras rationally. You can achieve two aims at once: CCTV Design Tool saves your time and your money and helps you make professional video surveillance system.HelpDesk
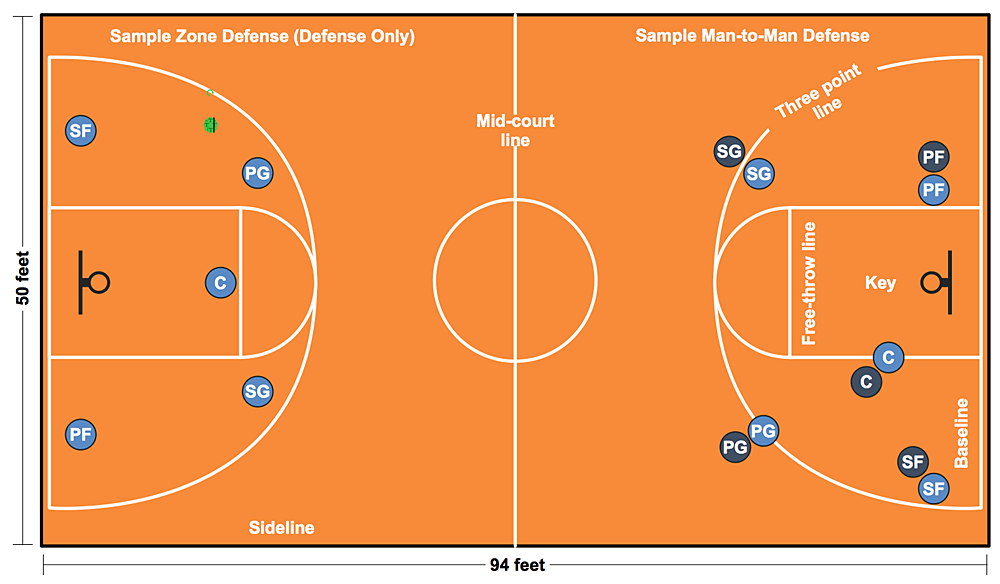
How to Make a Basketball Court Diagram
Basketball Court diagrams is often used as a teaching and learning tool for coaches, players and parents to describe the basketball moves and shooting drills. The ability to create Basketball diagrams with ConceptDraw PRO is contained in the Basketball solution. It provides a set of special tools for creating different Basketball diagrams. Basketball court diagram is used to describe basketball moves and shooting drills during the discussion of the match, as well as to develop a winning defense and attack strategy as a clear visual plans for future games.HelpDesk
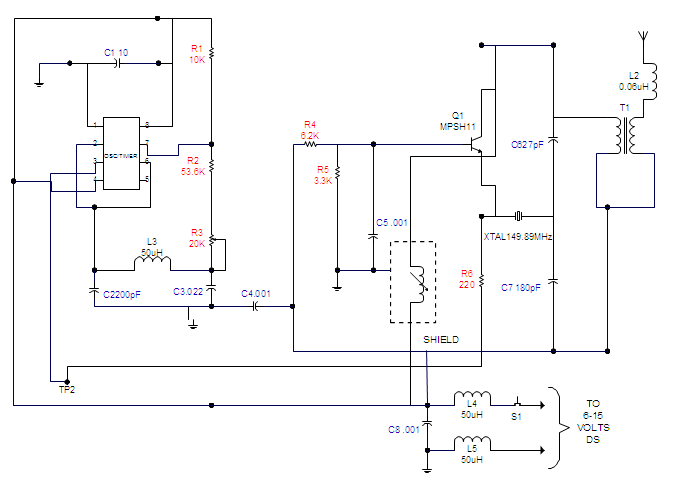
How to Create an Electrical Diagram Using ConceptDraw PRO
There are many of different electric circuit symbols that can be used in a circuit diagram. Knowing how to read circuit diagrams is a useful skill not only for professionals, but for any person who can start creating his own small home electronic projects. The circuit diagram shows the scheme of a location of components and connections of the electrical circuit using a set of standard symbols. It can be use for graphical documentation of an electrical circuit components. The ability to create electrical diagrams and schematic using ConceptDraw PRO is delivered by the Electrical Engineering solution. The solution supplied with samples, templates and libraries of design elements for drawing electrical schematics, digital and analog logic, circuit and wiring schematics and diagrams, power systems diagrams, maintenance and repair diagrams for electronics and electrical engineering.HelpDesk
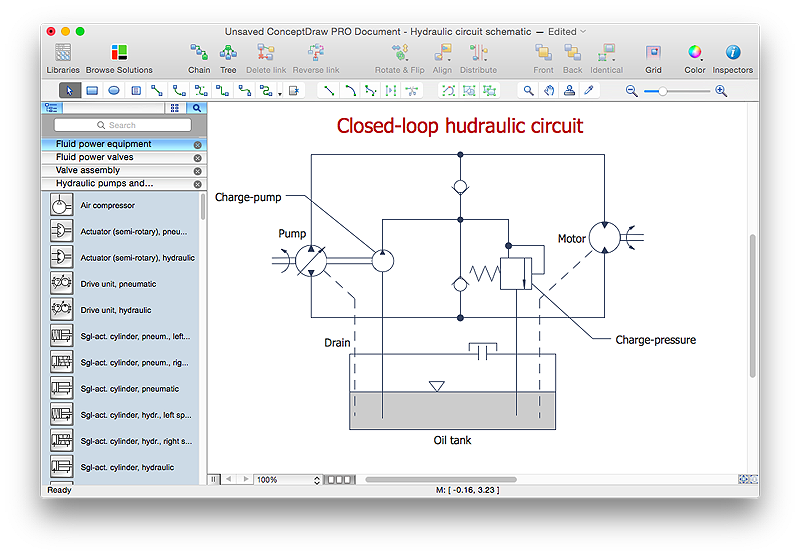
How to Create a Mechanical Diagram
Mechanical Engineering drawing is a type of technical drawing that helps analyze complex engineering systems. Mechanical Engineering diagrams are often a set of detailed drawings used for engineering or construction projects. Making Mechanical Engineering diagram involves many different elements that can be managed using ConceptDraw PRO. You can design elements for drawing parts, assembly, pneumatic, and hydraulic systems for mechanical engineering. With ConceptDraw PRO you can easily create and communicate the Mechanical Engineering diagram of any complexity.HelpDesk
How to Create a Venn Diagram in ConceptDraw PRO
Venn diagrams were invented by John Venn as a method of depicting relationships between different components. A Venn diagram consists of two or more circles. Each circle represents a specific group or set. The entities which are depicted by circles generally have some common characteristics. A Venn Diagram shows all the possible logical relations between these entities. Any properties that belong to more than one set should be indicated in the sections where the circles overlap. A Venn Diagram can be useful to visually summarize the status and future viability of a project. ConceptDraw PRO allows you to make a Venn diagrams using the Venn Diagrams solution.HelpDesk
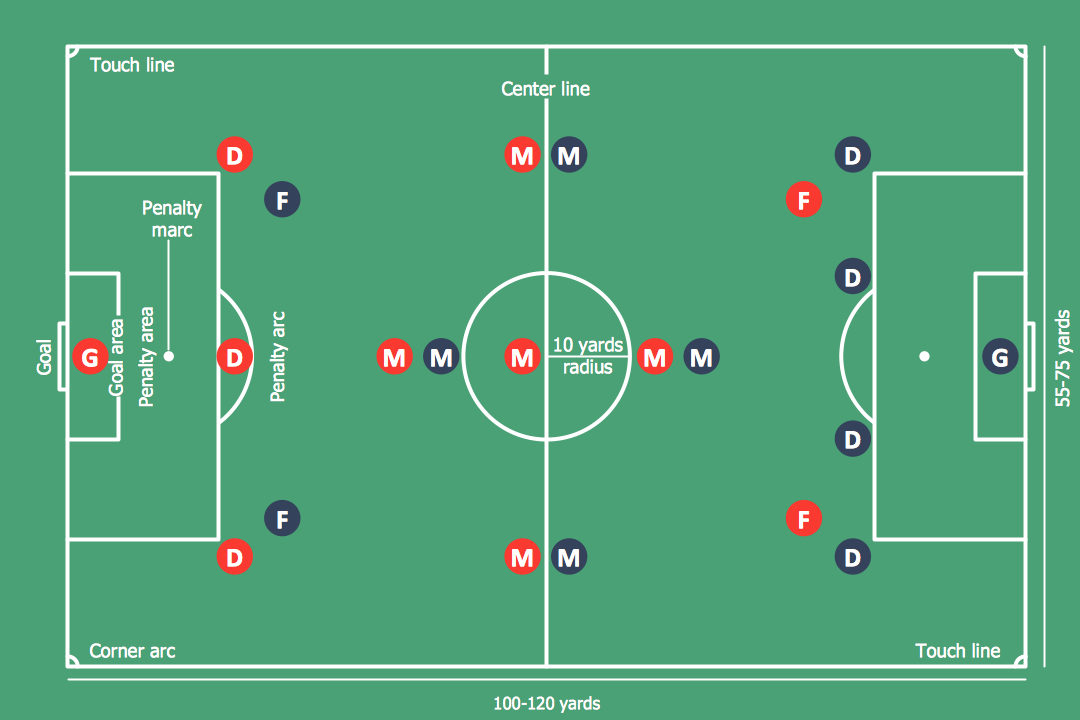
How to Make Soccer Position Diagram Using ConceptDraw PRO
The soccer field has the form of a large rectangle, covered with grass. Dimensions of soccer fields may vary slightly, depending on the level of the game, but all fields have some common characteristics. Soccer players may take different positions. Each soccer position has its own name, and implies certain player functions. Every soccer position has a very specific name and task: Goalkeeper, Defenders, Midfielders and Forwards. During preparation for the game coach met a challenge: how to explain each player's position and his role in the game. The difficulty is the fact that in the course of the game players will often move on the field and do not stay in one place. Football field diagram with dimensions and marking, and positions - it is an important tool for the coach. ConceptDraw PRO helps both coach and players to understand exactly their roles during the particular game. The ability to create Soccer diagrams is contained in the ConceptDraw Soccer solution. The solution providesHow To create Diagrams for Amazon Web Services architecture
Want to create Diagrams for Amazon Web Services architecture? ConceptDraw Solution Park with AWS architecture Solution will help you!- Cross-Functional Flowchart (Swim Lanes) | Swim Lane Diagrams ...
- How To create Diagrams for Amazon Web Services architecture ...
- Event-driven Process Chain Diagrams EPC | How to Create an ...
- Flow chart Example. Warehouse Flowchart | Workflow Diagrams ...
- How to Draw a Computer Network Diagrams
- How To create Diagrams for Amazon Web Services architecture ...
- Telecommunication Network Diagrams | How To Create a MS Visio ...
- Data Flow Diagrams | Data Flow Diagrams | How to Create a Data ...
- How to Create a Data Flow Diagram using ConceptDraw PRO | Data ...
- How To Create the Affinity Diagram | Affinity diagram - Implementing ...
- Wireless Networks | Wireless Network Diagram Examples | How to ...
- How to Create an Electrical Diagram Using ConceptDraw PRO ...
- Venn Diagrams | Venn Diagram | How to Create a Venn Diagram in ...
- How to Draw a Circular Arrows Diagram Using ConceptDraw PRO ...
- Draw Block Diagram Communication System Osx
- Cause and Effect Analysis (Fishbone Diagrams ) | How To Create ...
- Block Diagrams
- Logical network topology diagram | Network Topologies | Network ...
- How to Create a Social Media DFD Flowchart | Business Diagram ...
- Create Flow Chart on Mac | Workflow Diagram Software Mac ...


