TOWS Analysis Software
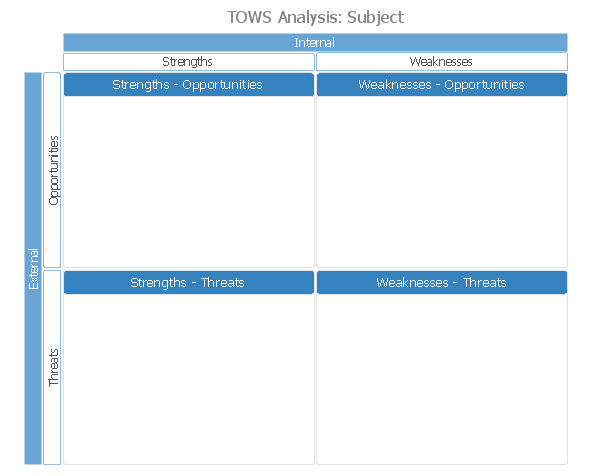
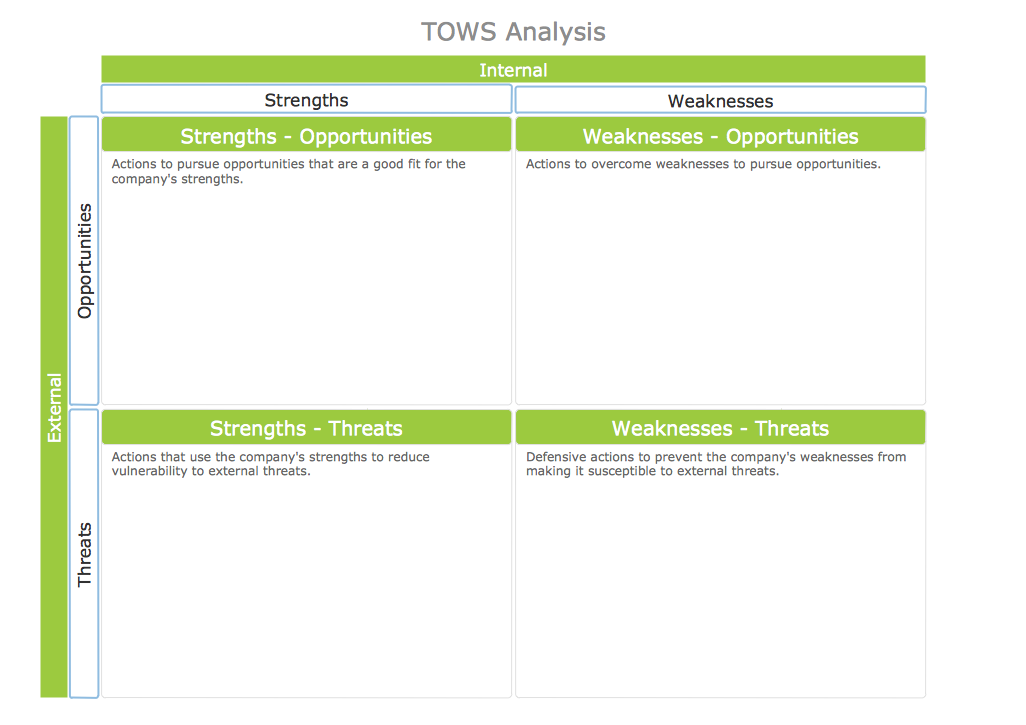
TOWS Analysis
Competitor Analysis

 SWOT and TOWS Matrix Diagrams
SWOT and TOWS Matrix Diagrams solution extends ConceptDraw DIAGRAM and ConceptDraw MINDMAP software with features, templates, samples and libraries of vector stencils for drawing SWOT and TOWS analysis matrices and mind maps.
SWOT Analysis Software

CORRECTIVE ACTIONS PLANNING. Involvement Matrix


Root Cause Analysis

SWOT Template

 Floor Plans
Construction, repair and remodeling of the home, flat, office, or any other building or premise begins with the development of detailed building plan and floor plans. Correct and quick visualization of the building ideas is important for further construction of any building.
Gant Chart in Project Management


 Stakeholder Onion Diagrams
The Stakeholder Onion Diagram is often used as a way to view the relationships of stakeholders to a project goal. A basic Onion Diagram contains a rich information. It shows significance of stakeholders that will have has influence to the success achieve
 PM Dashboards
The PM Dashboards solution extends the management boundaries of ConceptDraw DIAGRAM and ConceptDraw PROJECT products with an ability to demonstrate changes to the budget status, to show the project progress toward its objectives, to display clearly the identified key performance indicator (KPI) or the set of key performance indicators for any project. This solution provides you with examples and ability to generate three types of visual dashboards reports based on your project data Project Dashboard, Tactical Dashboard, and Radar Chart. By dynamically charting the project’s key performance indicators that are collected on one ConceptDraw DIAGRAM document page, all project participants, project managers, team members, team leaders, stakeholders, and the entire organizations, for which this solution is intended, have access to the daily status of projects they are involved in.
Authority Matrix Diagram Software

 HR Flowcharts
Human resource management diagrams show recruitment models, the hiring process and human resource development of human resources.
Fishbone Software Tools for Design Element
_Win_Mac.png)
- Construction Of Tows Matrix From Swat Analysis
- Steps Involved In Constructing A Tows Matrix
- SWOT analysis matrix diagram templates | SWOT Matrix Template ...
- Swot Analysis For Construction Company Example
- Construction Site Swot Analysis Examples
- Swot Analysis Examples
- Swot Analysis Construction Company Pdf
- SWOT Matrix Template | Swot Analysis Examples | SWOT Analysis ...
- TOWS analysis matrix - Template
- TOWS Analysis Software
- TOWS Analysis Software | TOWS Matrix | SWOT Analysis Solution ...
- TOWS Matrix | TOWS Analysis | TOWS Analysis Software | Tows A
- TOWS Matrix | How to Create a PowerPoint Presentation from a ...
- Swot Analysis For Construction Company Pdf
- TOWS Matrix | TOWS analysis matrix - Template | SWOT Analysis ...
- TOWS analysis matrix - Template | TOWS Matrix | SWOT Analysis ...
- TOWS Matrix | SWOT Analysis Solution - Strategy Tools | TOWS ...
- TOWS Matrix | TOWS Analysis Software | TOWS Analysis | Tows ...
- SWOT Analysis | Human Resource Development | SWOT and TOWS ...