 Block Diagrams
Block diagrams solution extends ConceptDraw PRO software with templates, samples and libraries of vector stencils for drawing the block diagrams.
What Is a Concept Map

Process Flowchart


Concept Maps

Best Diagramming


Basic Flowchart Symbols and Meaning


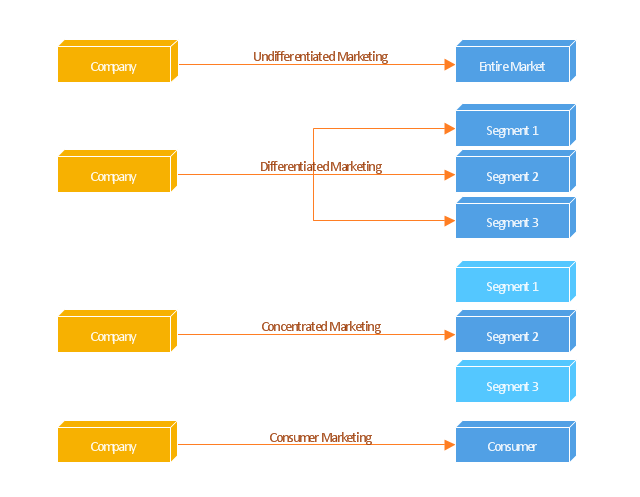
"Targeted advertising is a type of advertising whereby advertisements are placed so as to reach consumers based on various traits such as demographics, psychographics, behavioral variables (such as product purchase history), and firmographic variables ... or other second-order activities which serve as a proxy for these traits.
Most targeted new media advertising currently uses second-order proxies for targeting, such as tracking online or mobile web activities of consumers, associating historical webpage consumer demographics with new consumer web page access, using a search word as the basis for implied interest, or contextual advertising.
Addressable advertising systems serve ads directly based on demographic, psychographic, or behavioral attributes associated with the consumer(s) exposed to the ad. These systems are always digital and must be addressable in that the end point which serves the ad (set-top box, website, or digital sign) must be capable of rendering an ad independently of any other end points based on consumer attributes specific to that end point at the time the ad is served. Addressable advertising systems therefore must use consumer traits associated with the end points as the basis for selecting and serving ads." [Targeted advertising. Wikipedia]
The block diagram example "Marketing targeting" was created using the ConceptDraw PRO diagramming and vector drawing software extended with the Block Diagrams solution from the area "What is a Diagram" of ConceptDraw Solution Park.
Block diagram
 Basic Diagramming
This solution extends ConceptDraw PRO software with the specific tools you need to easily draw flowcharts, block diagrams, histograms, pie charts, divided bar diagrams, line graphs, circular arrows diagrams, Venn diagrams, bubble diagrams and concept maps
HelpDesk
How to Draw a Block Diagram in ConceptDraw PRO

 Marketing Diagrams
Marketing Diagrams solution extends ConceptDraw PRO diagramming software with abundance of samples, templates and vector design elements intended for easy graphical visualization and drawing different types of Marketing diagrams and graphs, including Branding Strategies Diagram, Five Forces Model Diagram, Decision Tree Diagram, Puzzle Diagram, Step Diagram, Process Chart, Strategy Map, Funnel Diagram, Value Chain Diagram, Ladder of Customer Loyalty Diagram, Leaky Bucket Diagram, Promotional Mix Diagram, Service-Goods Continuum Diagram, Six Markets Model Diagram, Sources of Customer Satisfaction Diagram, etc. Analyze effectively the marketing activity of your company and apply the optimal marketing methods with ConceptDraw PRO software.
Basic Diagramming


 ConceptDraw Solution Park
ConceptDraw Solution Park collects graphic extensions, examples and learning materials
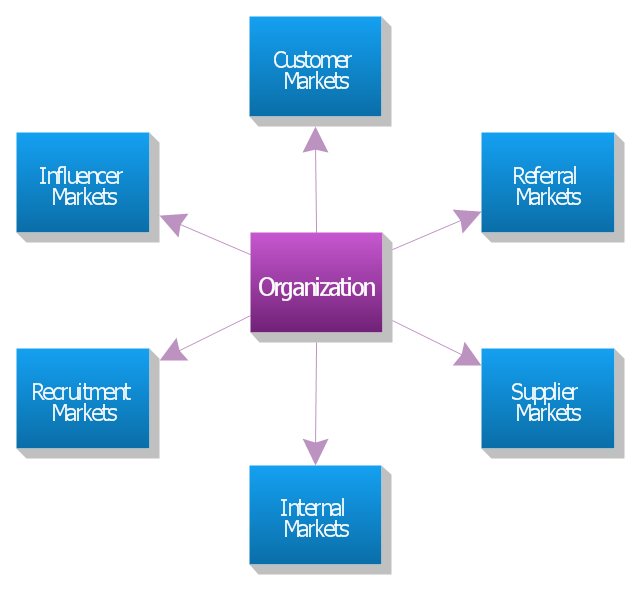
"The six markets model.
Christopher, Payne and Ballantyne (1991) from Cranfield University goes further. They identify six markets which they claim are central to relationship marketing. They are: internal markets, supplier markets, recruitment markets, referral markets, influence markets, and customer markets.
Referral marketing is developing and implementing a marketing plan to stimulate referrals. Although it may take months before you see the effect of referral marketing, this is often the most effective part of an overall marketing plan and the best use of resources.
Marketing to suppliers is aimed at ensuring a long-term conflict-free relationship in which all parties understand each other's needs and exceed each other's expectations. Such a strategy can reduce costs and improve quality.
Influence markets involve a wide range of sub-markets including: government regulators, standards bodies, lobbyists, stockholders, bankers, venture capitalists, financial analysts, stockbrokers, consumer associations, environmental associations, and labor associations. These activities are typically carried out by the public relations department, but relationship marketers feel that marketing to all six markets is the responsibility of everyone in the organization. Each market may require its own explicit strategies and a separate marketing mix for each." [Relationship marketing. Wikipedia]
The block diagram example "Six markets model" was created using the ConceptDraw PRO diagramming and vector drawing software extended with the Block Diagrams solution from the area "What is a Diagram" of ConceptDraw Solution Park.
Block diagram
 Venn Diagrams
Venn Diagrams are actively used to illustrate simple set relationships in set theory and probability theory, logic and statistics, mathematics and computer science, linguistics, sociology, and marketing. Venn Diagrams are also often used to visually summarize the status and future viability of a project.
HelpDesk
How To Create MS Visio Block Diagram

- Block Diagram Marketing Management
- Block Diagrams | Total Quality Management with ConceptDraw ...
- Basic Flowchart Symbols and Meaning | Marketing | How to Draw a ...
- Relationship marketing | Block diagram
- Diagram Marketing Concept
- How To Product Concept To Block Diagram
- Concept Of Product Market With Diagram
- Target market - Onion diagram | Block diagram - Marketing targeting ...
- Block diagram - Marketing targeting | Target market | Scatter Chart ...
- Target Diagram | Block diagram - Marketing targeting | Target and ...
- Marketing Diagrams | Flow chart Example. Warehouse Flowchart ...
- Block diagram - Sources of customer satisfaction | Block diagram ...
- Block diagram - Marketing targeting | Website Wireframe | Word Web ...
- Customer Marketing Diagram
- Target market | Target market - Onion diagram | Scatter Chart ...
- Block Diagrams | Basic Flowchart Symbols and Meaning | Process ...
- Marketing Diagrams | Flowchart Marketing Process. Flowchart ...
- Marketing - Vector stencils library | Rack Diagrams | With The Aid Of ...
- Marketing mix - Wheel diagram | Target diagrams - Vector stencils ...
- Concept Of Prroduct Market With Diagram