This example is based on the organizational chart from the Ohio State University website. [osu.edu/ vpsearch/ images/ University_ Org_ Chart.png]
"The Ohio State University, a multi-campus land grant institution with an international presence, is a world-class public research university and the leading comprehensive teaching and research institution in the state, Ohio's flagship university. Ohio State provides a distinctive educational experience for students and pursues cutting-edge interdisciplinary research that brings together scholars from diverse disciplines to solve key problems in society.
One of the University's core values is to "ignite a lifelong love of learning" in students. Ohio State students benefit from a scholarly environment in which research inspires and informs teaching.
The Vice President for Student Life provides vision, leadership, and strategic direction to the Office of Student Life, a comprehensive unit dedicated to supporting the educational mission of the University and promoting the best possible overall experience for the diverse student body of approximately 60,000. The Office of Student Life supports every aspect of Ohio State students experience. Its scope includes housing, campus dining, disability services, the multicultural center, counseling and health services, student organizations and leadership development, and other related operations." [osu.edu/ vpsearch/ ]
The organizational chart example "University leadership" was created using the ConceptDraw PRO diagramming and vector drawing software extended with the Organizational Charts solution from the Management area of ConceptDraw Solution Park.
Organizational chart - University leadership

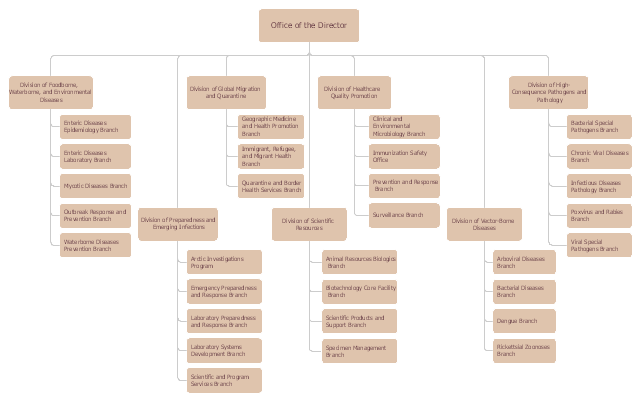
This example is based on the organizational chart from the NCEZID website. [cdc.gov/ ncezid/ org-ncezid.html]
"The National Center for Emerging and Zoonotic Infectious Diseases aims to prevent disease, disability, and death caused by a wide range of infectious diseases. We focus on diseases that have been around for many years, emerging diseases (those that are new or just recently identified), and zoonotic diseases (those spread from animals to people). Our work is guided in part by a holistic "One Health" strategy, which recognizes the vital interconnectedness of microbes and the environment. Through a comprehensive approach involving many scientific disciplines, we can attain better health for humans and animals and improve our environment.
To carry out our mission, we use many different tactics: providing leadership in public health, conducting exemplary science, strengthening preparedness efforts, establishing public health policy, sharing vital health information with the public, and building partnerships. Each of the center’s seven divisions works with partners to protect and improve the public’s health in the United States and worldwide." [cdc.gov/ ncezid/ ]
The organizational chart example "National Center for Emerging and Zoonotic Infectious Diseases" was created using the ConceptDraw PRO diagramming and vector drawing software extended with the Organizational Charts solution from the Management area of ConceptDraw Solution Park.
Organizational chart - National Center for Emerging and Zoonotic Infectious Diseases
Organizational Structure Total Quality Management

Draw Company Structure with Organization Charting Software

Draw Company Structure Diagram - get the detailed information about the company structure and hierarchy - who execute what tasks and who is in charge at this company. This information shows the reasoning and success of business and is indispensable for investors and financial institutions.
Flow chart Example. Warehouse Flowchart


Product Overview

 ConceptDraw Solution Park
ConceptDraw Solution Park collects graphic extensions, examples and learning materials
Example of Flowchart Diagram

Network Visualization with ConceptDraw PRO

Sales Process Flowchart Symbols

HelpDesk
How to Add a Workflow Diagram to a PowerPoint Presentation

Best Flowchart Software and Flowchart Symbols

Easy Flowchart Program and Standard Flowchart Symbols

Audit Flowchart Symbols

In searching of alternative to MS Visio for MAC and PC with ConceptDraw PRO

- How to Draw an Organization Chart | Organizational Charts | How to ...
- Example Of A Comprehensive Organization Chart Of Any Company ...
- Draw A Comprehensive Organisation Chart
- Comprehensive Organisation Chart
- Comprehensive Organizational Chart
- How to Draw an Organization Chart | Organizational Chart Template ...
- Draw A Comprehensive Organisation Chart Of Any Company
- Draw A Comprehensive Organisation Chart Of Company
- Draw A Comprehensive Organization Chat
- Draw A Comprehensive Organisation Of Any Company
- Draw A Comprehensive Organization Of Any Company
- Draw Comprehensive Flow Chart
- Example of Organizational Chart | Organizational Charts ...
- Examples of Flowcharts, Org Charts and More | Flow chart Example ...
- Organizational Charts | How to Create a HR Process Flowchart ...
- Organizational Structure | Matrix Organization Structure | How to ...
- Organizational chart - University leadership | Organizational ...
- How to Draw an Organization Chart | Organizational Charts with ...
- Organizational chart - University leadership | SWOT analysis for a ...