SWOT Analysis

What is SWOT Analysis in Marketing

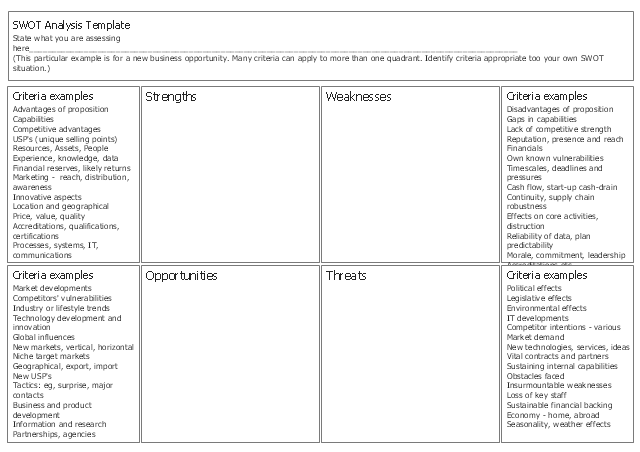
"SWOT Analysis.
A way to identify and analyze a company's goals by assessing its strength, weaknesses, opportunities, and threats. An advantage to SWOT analysis is that it separates internal factors (strengths and weaknesses) from external ones (opportunities and threats). This allows the company to match what it could do in theory with what is possible in reality. Another advantage is the fact that conducting SWOT analysis is straightforward if the company conducting it is honest with itself." [financial-dictionary.thefreedictionary.com/ SWOT+Analysis]
This form template "New business opportunity SWOT analysis matrix" for the ConceptDraw PRO diagramming and vector drawing software is included in the SWOT Analysis solution from the Management area of ConceptDraw Solution Park.
SWOT matrix template
What is SWOT Analysis?

HelpDesk
How to Create a SWOT Matrix Quickly

TOWS Matrix

 Management Area
The solutions from Management area of ConceptDraw Solution Park collect templates, samples and libraries of vector stencils for drawing the management diagrams and mind maps.
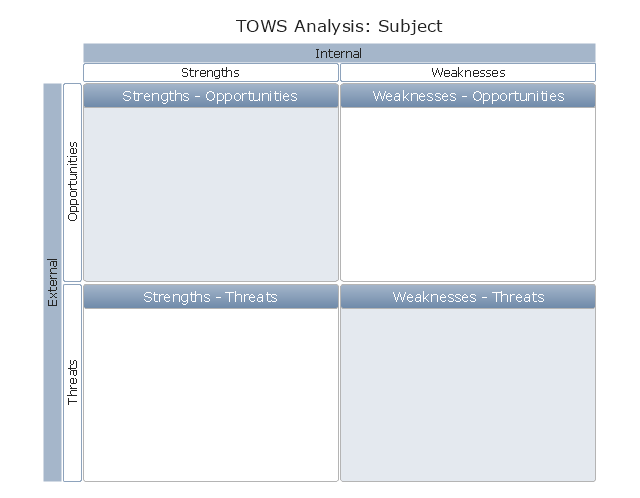
"The TOWS matrix ... serves as a conceptual framework for future research about the combination of external factors and those internal to the enterprise, and the strategies based on these variables.
Equally important, the matrix 'forces' practicing managers to analyze the situation of their company and to develop
strategies, tactics, and actions for the effective and efficient attainment of its organizational objectives and its mission." [usfca.edu/ fac_ staff/ weihrichh/ docs/ tows.pdf]
This TOWS analysis matrix diagram template for the ConceptDraw PRO diagramming and vector drawing software is included in the SWOT Analysis solution from the Management area of ConceptDraw Solution Park.
TOWS matrix template
"Porter five forces analysis is a framework for industry analysis and business strategy development. It draws upon industrial organization (IO) economics to derive five forces that determine the competitive intensity and therefore attractiveness of a market. Attractiveness in this context refers to the overall industry profitability. An "unattractive" industry is one in which the combination of these five forces acts to drive down overall profitability. A very unattractive industry would be one approaching "pure competition", in which available profits for all firms are driven to normal profit.
Three of Porter's five forces refer to competition from external sources. The remainder are internal threats.
Porter referred to these forces as the micro environment, to contrast it with the more general term macro environment. They consist of those forces close to a company that affect its ability to serve its customers and make a profit. A change in any of the forces normally requires a business unit to re-assess the marketplace given the overall change in industry information. The overall industry attractiveness does not imply that every firm in the industry will return the same profitability. Firms are able to apply their core competencies, business model or network to achieve a profit above the industry average. A clear example of this is the airline industry. As an industry, profitability is low and yet individual companies, by applying unique business models, have been able to make a return in excess of the industry average.
Porter's five forces include - three forces from 'horizontal' competition: the threat of substitute products or services, the threat of established rivals, and the threat of new entrants; and two forces from 'vertical' competition: the bargaining power of suppliers and the bargaining power of customers.
This five forces analysis, is just one part of the complete Porter strategic models. The other elements are the value chain and the generic strategies." [Porter five forces analysis. Wikipedia]
The block diagram example "Porter's five forces model" was created using the ConceptDraw PRO diagramming and vector drawing software extended with the Block Diagrams solution from the area "What is a Diagram" of ConceptDraw Solution Park.
Block diagram

Types of Flowcharts


Network Visualization with ConceptDraw PRO

 Computer Network Diagrams
Computer Network Diagrams solution extends ConceptDraw PRO software with samples, templates and libraries of vector icons and objects of computer network devices and network components to help you create professional-looking Computer Network Diagrams, to plan simple home networks and complex computer network configurations for large buildings, to represent their schemes in a comprehensible graphical view, to document computer networks configurations, to depict the interactions between network's components, the used protocols and topologies, to represent physical and logical network structures, to compare visually different topologies and to depict their combinations, to represent in details the network structure with help of schemes, to study and analyze the network configurations, to communicate effectively to engineers, stakeholders and end-users, to track network working and troubleshoot, if necessary.
 Dashboards Area
Solutions from the area Dashboards of ConceptDraw Solution Park collects templates, samples and vector stencils libraries with of data driven charts and indicators for drawing the basic types of Visual Dashboards.
 PM Dashboards
The PM Dashboards solution extends the management boundaries of ConceptDraw PRO and ConceptDraw PROJECT products with an ability to demonstrate changes to the budget status, to show the project progress toward its objectives, to display clearly the identified key performance indicator (KPI) or the set of key performance indicators for any project. This solution provides you with examples and ability to generate three types of visual dashboards reports based on your project data Project Dashboard, Tactical Dashboard, and Radar Chart. By dynamically charting the project’s key performance indicators that are collected on one ConceptDraw PRO document page, all project participants, project managers, team members, team leaders, stakeholders, and the entire organizations, for which this solution is intended, have access to the daily status of projects they are involved in.
Basic Flowchart Symbols and Meaning


- Swot Analysis Examples | SWOT analysis matrix diagram templates ...
- SWOT Sample in Computers | Swot Analysis Examples | Swot ...
- Swot Analysis Strengths, Weaknesses, Opportunities, and Threats ...
- Sales Dashboard | Swot Analysis Examples | Sales KPIs ...
- What is SWOT Analysis in Marketing | Positioning map (Perceptual ...
- New business opportunity SWOT analysis matrix - Template portrait ...
- New business opportunity SWOT analysis matrix - Template portrait ...
- Small business consultancy SWOT analysis matrix | SWOT analysis ...
- TOWS analysis matrix diagram - instructional sample | Swot Analysis ...
- Boston growth-share (BCG) matrix diagram | Swot Analysis ...
- Mind Maps for Business - SWOT Analysis | Audio, Video, Media ...
- SWOT Analysis Solution - Strategy Tools | TOWS analysis matrix ...
- What is SWOT Analysis in Marketing
- SWOT Analysis | New business opportunity SWOT analysis matrix ...
- New business opportunity SWOT analysis matrix - Template portrait ...
- SWOT Analysis | Swot Analysis Examples | Swot Analysis Strengths ...
- Porter's generic strategies matrix diagram | SWOT Analysis Solution ...
- SWOT Analysis | SWOT Sample in Computers | Swot Analysis ...
- SWOT Analysis Solution - Strategy Tools | Mind Maps for Business ...
- Positioning map (Perceptual map) | SWOT Analysis Solution ...