Basic Flowchart Symbols and Meaning


The vector stencils library "EPC diagrams" contains 23 EPC symbols.
Use it for drawing event-driven process chain (EPC) diagrams in the ConceptDraw PRO diagramming and vector drawing software extended with the Event-driven Process Chain Diagrams solution from the Business Processes area of ConceptDraw Solution Park.
www.conceptdraw.com/ solution-park/ business-process-EPC
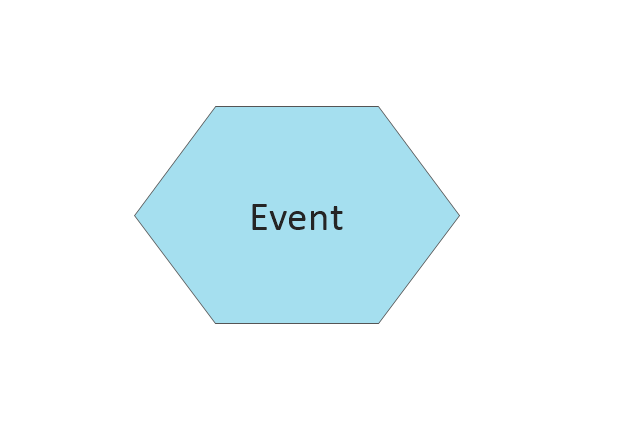
Event
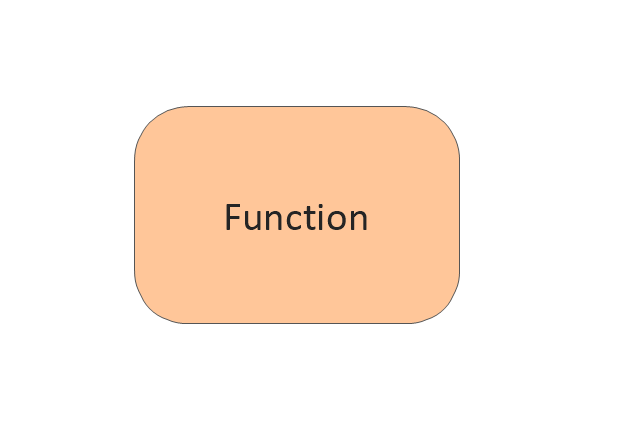
Function
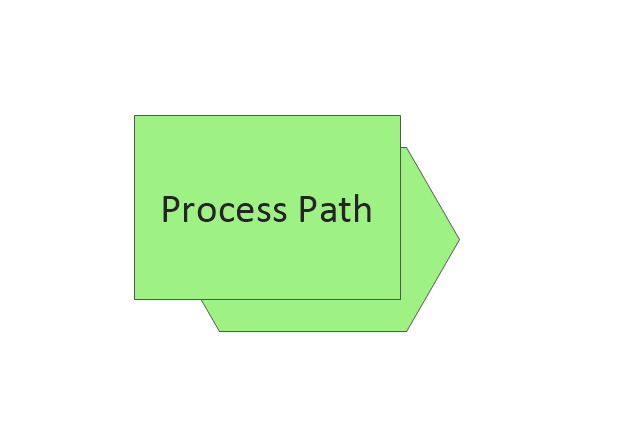
Process path
XOR operator

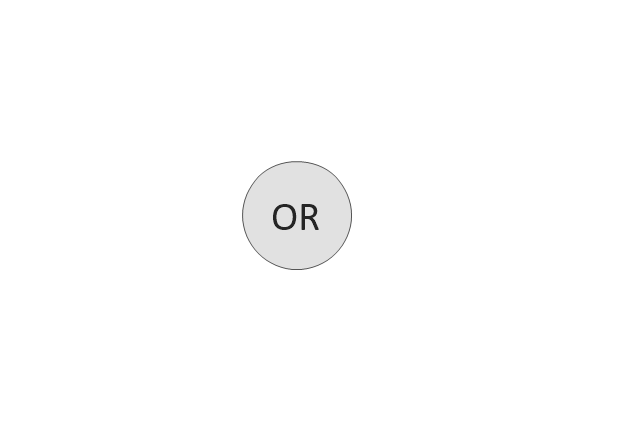
OR operator
AND operator

Information/ Material Object
Organization Unit
Process Group
System
Comment 1

Comment 2

Control flow (Direct)
-epc-diagrams---vector-stencils-library.png--diagram-flowchart-example.png)
Information flow (Direct)
-epc-diagrams---vector-stencils-library.png--diagram-flowchart-example.png)
Organiztion unit assignment (Direct)
-epc-diagrams---vector-stencils-library.png--diagram-flowchart-example.png)
Control flow (Smart)
-epc-diagrams---vector-stencils-library.png--diagram-flowchart-example.png)
Information flow (Smart)
-epc-diagrams---vector-stencils-library.png--diagram-flowchart-example.png)
Organiztion unit assignment (Smart)
-epc-diagrams---vector-stencils-library.png--diagram-flowchart-example.png)
Information
Enterprise Area
Document
Database
Disk Storage
Flowchart

Business Process Elements: Activities
")

Lean Six Sigma Diagram Software

Business Process Elements: Events
")
UML Block Diagram

HelpDesk
How to Create a SIPOC Diagram

HelpDesk
How to Draw a Fishbone Diagram with ConceptDraw PRO

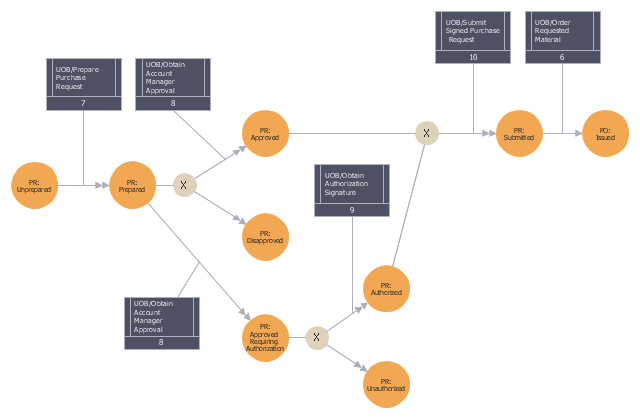
This IDEF3 diagram example was redesigned from the Wikimedia Commons file: 5-21 Completed Transition Schematic.jpg.
[commons.wikimedia.org/ wiki/ File:5-21_ Completed_ Transition_ Schematic.jpg]
"As with the Process Schematic, the correctness of the Object Schematic and
associated elaborations are confirmed through validation with the domain expert. After reviewing the Transition Schematic, the domain expert observes that the allowable state transitions displayed in the schematic do not include those representative of a failed request. ...
The domain expert also identified transitions through which the identity of the object was preserved and transitions where the object was actually transformed into an entirely different object. The domain expert’s comments to the analyst yield the schematic
depicted in Figure 5-21." [IDEF3 Process Description Capture Method Report AL-TR-1995-XXXX. idef.com/ pdf/ Idef3_ fn.pdf]
The sample "Completed transition schematic - IDEF3 diagram" was created using the ConceptDraw PRO diagramming and vector drawing software extended with the solution "IDEF Business Process Diagrams" from the area "Business Processes" of ConceptDraw Solution Park.
IDEF3 business process diagram
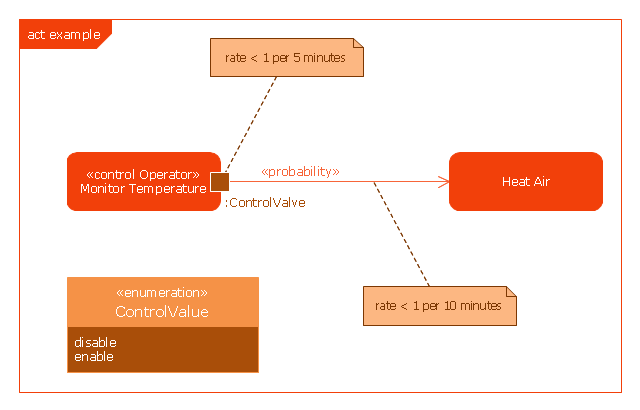
This example was drawn on the base of SysML activity diagram on the page 8 of "SysML Modelling Language explained" document from the Official OMG SysML site.
"The activity diagram represents steps of a process, often making use of “input and output pins” that respectively correspond to the element type required as the input of an activity or action, and the element generated as an output.
If an action or activity corresponds to a block operation, it is possible to ensure that the types of the input and output of this activity are consistent with the block operation signature.
All the activity diagrams definitions used in UML also apply to SysML.
SysML has added a couple of extensions:
- With UML, control can only enable actions to start. SysML extends control to support disabling of actions that are already executing.
- Definition of the flow rate : continuous or discrete
- Definition of the rate and probability on the control or object flows"
[omgsysml.org/ SysML_ Modelling_ Language_ explained-finance.pdf]
The example "SysML activity diagram" was drawn using the ConceptDraw PRO diagramming and vector drawing software extended with the SysML solution from the Software Development area of ConceptDraw Solution Park.
Example of SysML activity diagram
Affinity Diagram

Database Flowchart Symbols

Program Structure Diagram

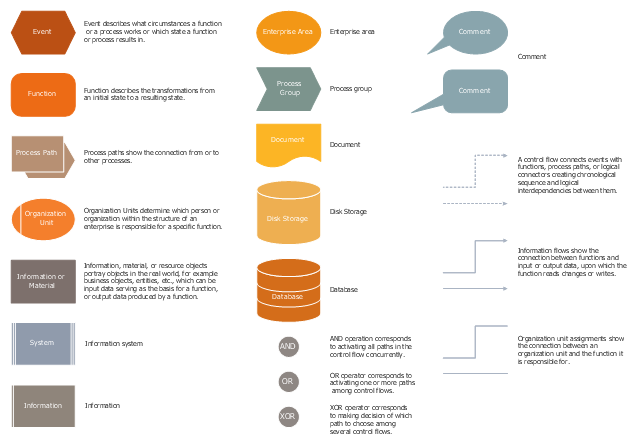
The vector stencils library "EPC diagrams" contains 23 symbol icons.
Use it to draw the event-driven process chain (EPC) flowcharts for business process modeling (BPM).
"... the elements used in Event-driven Process Chain diagram... :
(1) Event.
(2) Function.
(3) Process Owner.
(4) Organization unit.
(5) Information, material, or resource object.
(6) Logical connector.
(7) Logical relationships: Branch / Merge, Fork / Join, OR.
(8) Control flow.
(9) Information flow.
(10) Organization unit assignment.
(11) Process path. " [Event-driven process chain. Wikipedia]
The EPC symbols example "Design elements - EPC diagram" was created using the ConceptDraw PRO diagramming and vector drawing software extended with the Event-driven Process Chain Diagrams solution from the Business Processes area of ConceptDraw Solution Park.
EPC diagram symbols
- Credit Card Order Process Flowchart. Flowchart Examples | Active ...
- Remote Learning Sessions - Webinars | Business Process Elements ...
- Credit Card Order Process Flowchart. Flowchart Examples ...
- Process Flowchart | How to Create Flowcharts for an Accounting ...
- EPC diagrams - Vector stencils library | EPC diagrams - Vector ...
- Data Flow Diagram Model
- EPC diagrams - Vector stencils library
- Accounting Information Systems Flowchart Symbols | ERD Symbols ...
- Event-driven Process Chain Diagrams
- Basic Flowchart Symbols and Meaning | Yourdon and Coad ...
- SysML activity diagram | Diagramming Software for Design UML ...
- Process Diagram For A Point Of Sale
- Design elements - EPC diagram | Project management life cycle ...
- Business Process Diagrams | Social Media Flowchart Symbols ...
- Flowchart on Bank. Flowchart Examples | Process Flowchart | How ...
- Sales Process Flowchart Symbols | Computer Hardware - Reseller ...
- IDEF3 Standard | How to create an IDEF3 diagram using ...
- Venn Diagram Template for Word | SWOT Matrix Template | Onion ...
- Point Of Sale Process Flow Diagram
- Basic Flowchart Symbols and Meaning | How to Create a Fault Tree ...