Bar Chart

Bar Chart Examples

Bar Chart Software

Column Chart Examples

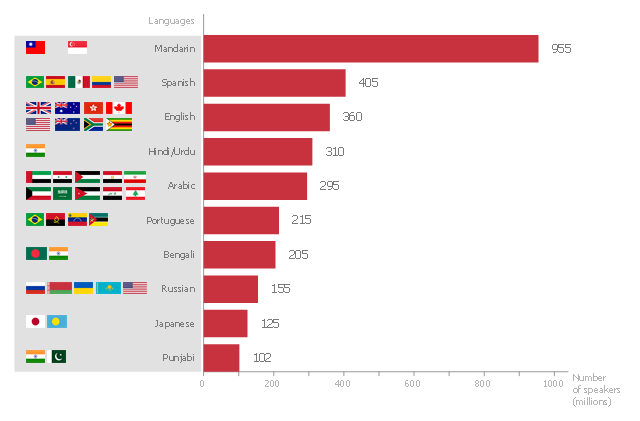
This bar graph sample shows the number of speakers for the most spoken languages of the world.
"In the philosophy of language, a natural language (or ordinary language) is any language which arises in an unpremeditated fashion as the result of the innate facility for language possessed by the human intellect. A natural language is typically used for communication, and may be spoken, signed, or written. Natural language is distinguished from constructed languages and formal languages such as computer-programming languages or the "languages" used in the study of formal logic, especially mathematical logic. ... Though the exact definition varies between scholars, natural language can broadly be defined in contrast on the one hand to artificial or constructed languages, computer programming languages like Python and international auxiliary languages like Esperanto, and on the other hand to other communication systems in nature, such as the waggle dance of bees. Although there are a variety of natural languages, any cognitively normal human infant is able to learn any natural language. By comparing the different natural languages, scholars hope to learn something about the nature of human intelligence and the innate biases and constraints that shape natural language, which are sometimes called universal grammar. The term "natural language" refers only a language that has developed naturally, and hence to actual speech, rather than prescribed speech. Hence, unstandardized speech (such as African American Vernacular English) is natural, whereas standardized speech such as Standard American English, which is in part prescribed, is somewhat artificial." [Natural language. Wikipedia]
The horizontal bar chart example "The most spoken languages of the world" was created using the ConceptDraw PRO diagramming and vector drawing software extended with the Bar Graphs solution from the Graphs and Charts area of ConceptDraw Solution Park.
Horizontal bar graph
Column Chart Software

Chart Templates

Chart Examples

Waterfall Bar Chart

Chart Maker for Presentations

How to Create a Bar Chart

Examples of Flowcharts, Org Charts and More


 Basic Bar Graphs
This solution enhances ConceptDraw DIAGRAM (or later) with templates, samples and a library of vector stencils for drawing Bar Graphs.
Polar Graph

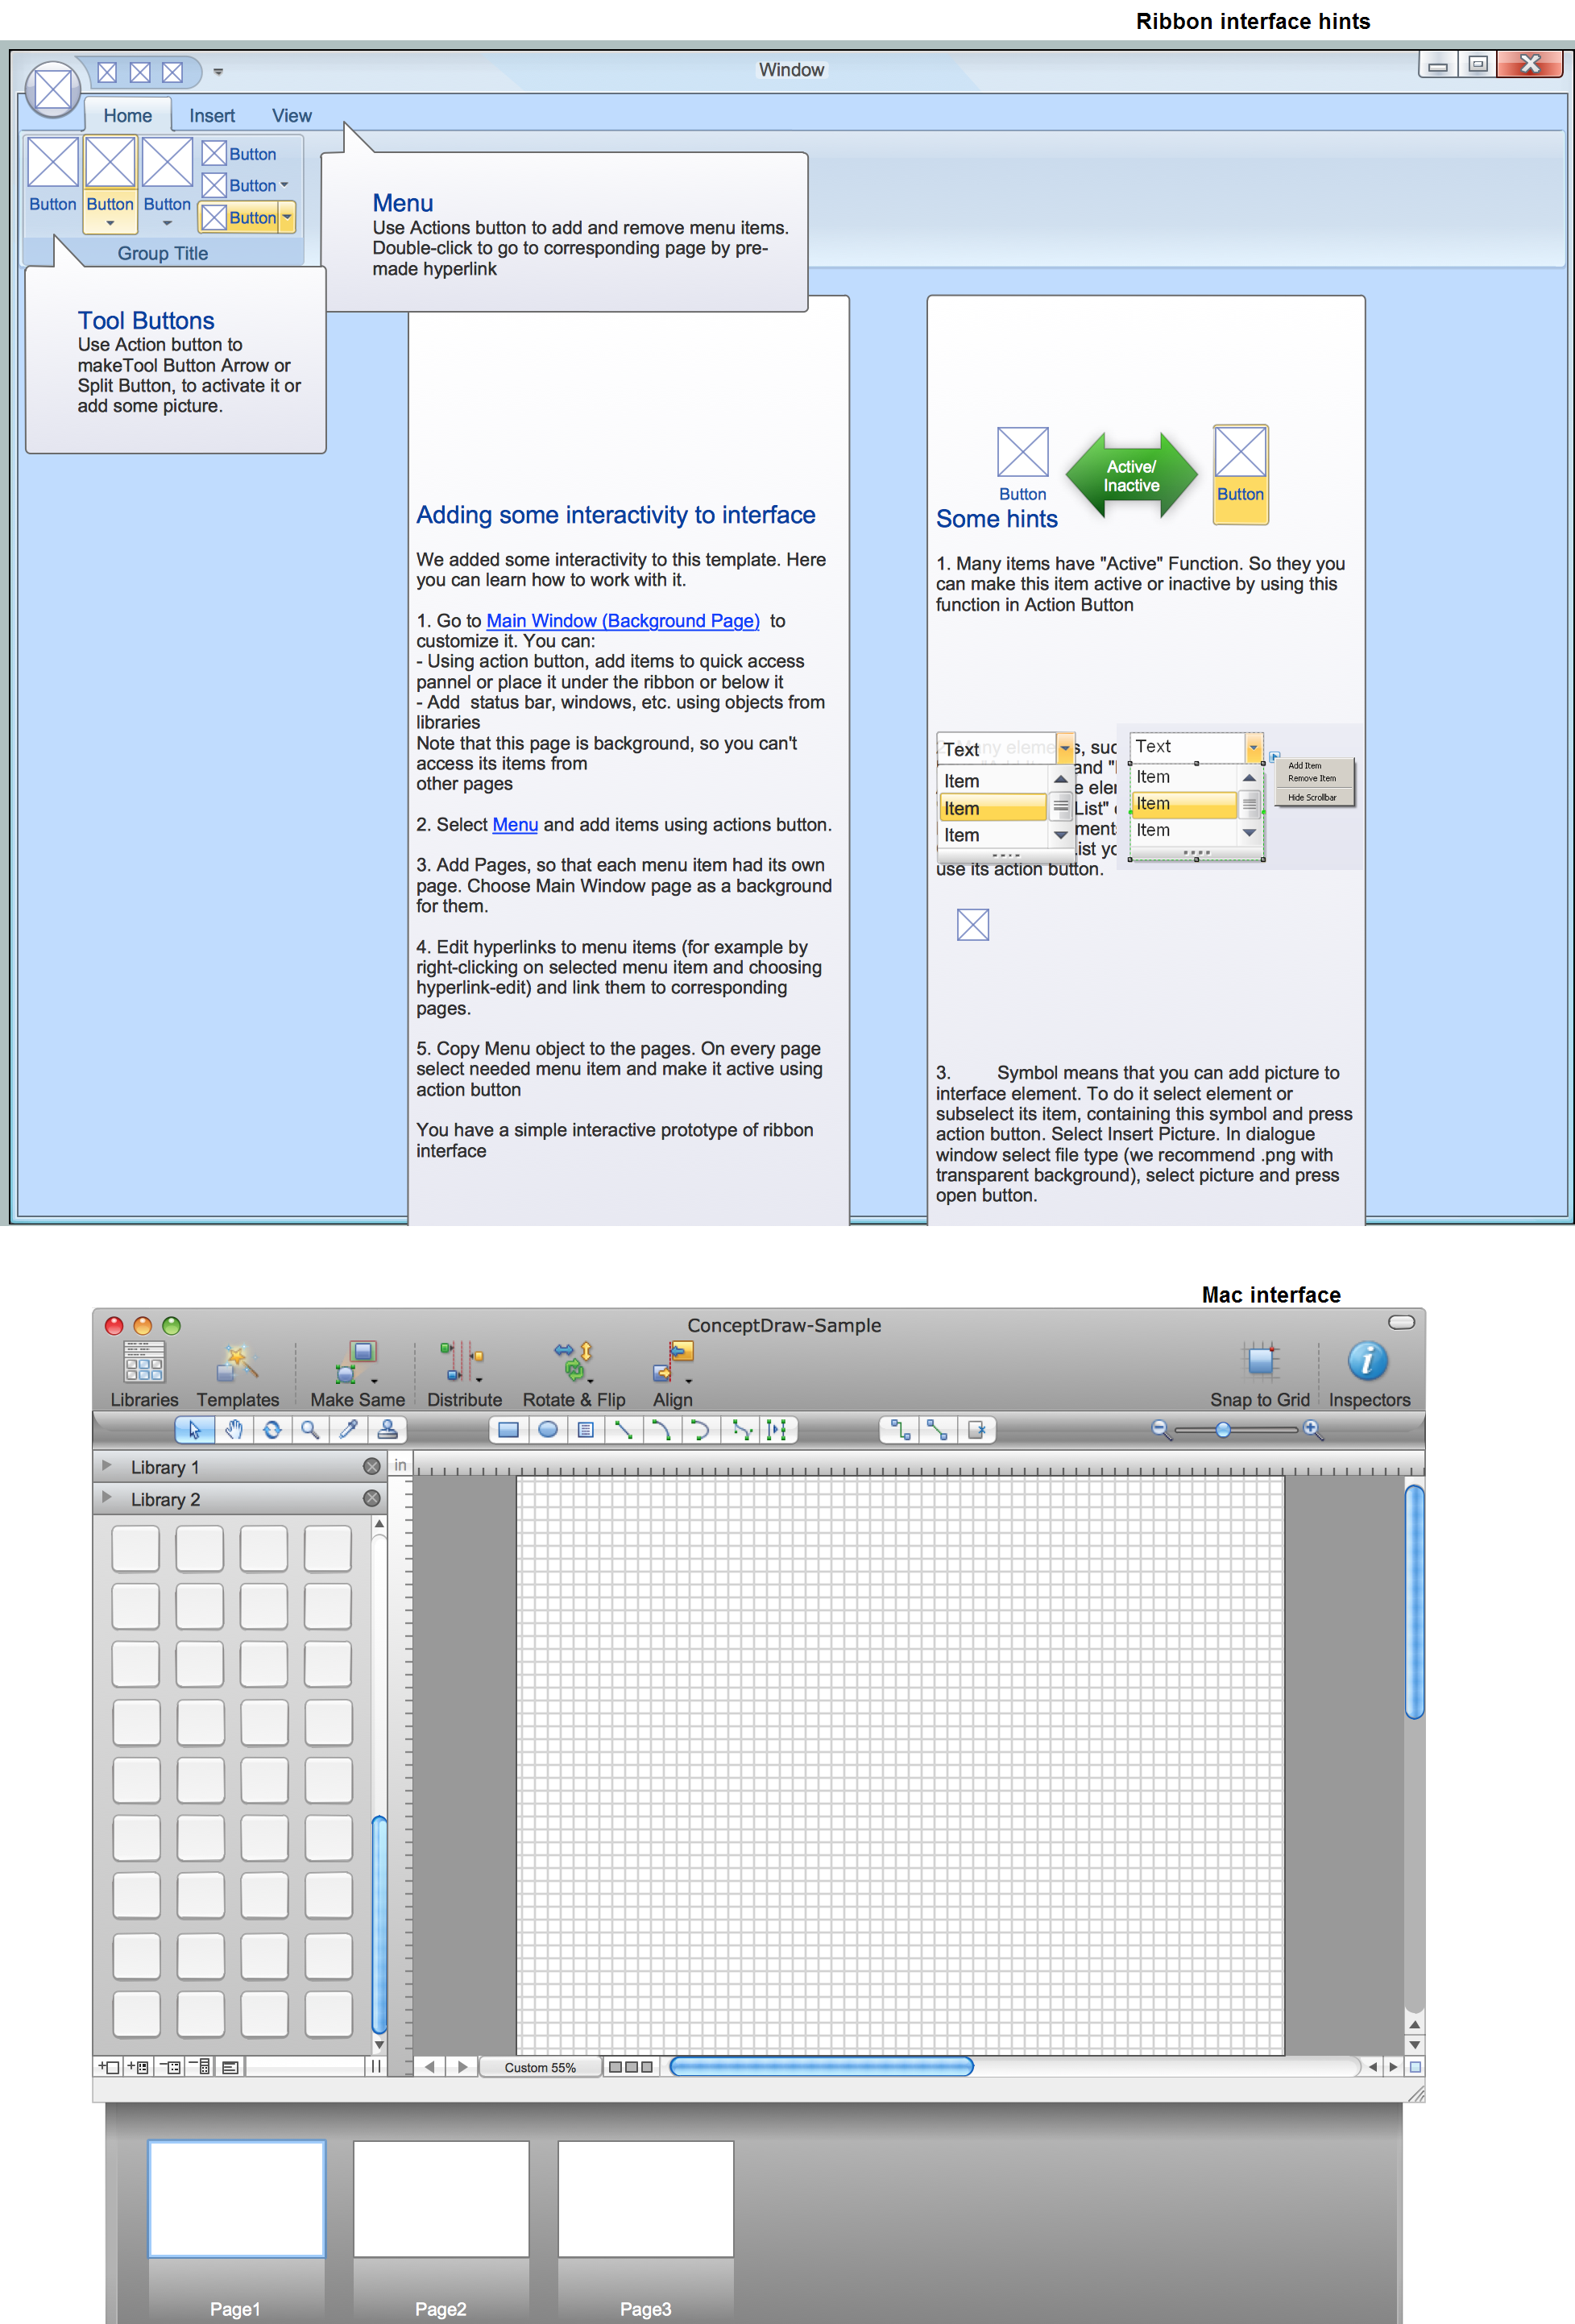
GUI Prototyping with ConceptDraw DIAGRAM
- The most spoken languages of the world | Bar Chart Software | Bar ...
- Horizontal bar chart - The most spoken languages of the world ...
- Horizontal bar chart - The most spoken languages of the world | Bar ...
- Languages Spoken Around The World Bargraph
- The most spoken languages of the world | Bar Chart | Bar Graphs ...
- The most spoken languages of the world | Bar Chart Software ...
- The most spoken languages of the world | Bar Chart Software | Chart ...
- Bar Chart Software | The most spoken languages of the world | Bar ...
- Horizontal bar chart - The most spoken languages of the world | Bar ...
- Bar Chart Software | Horizontal bar chart - The most spoken ...
- Horizontal bar chart - The most spoken languages of the world ...
- Bar Chart Software | UML Diagram | Block Diagram | World ...
- Bar Chart Software | Bar Chart | Bar Graphs | Most Spoken ...
- The most spoken languages of the world | Bar Diagrams for Problem ...
- Bar Chart Software | Bar Chart | Bar Graphs | Most Spoken Language
- Bar Graph
- Bar Chart Examples | How to Create a Bar Chart | How to Create a ...
- Bar Chart Software | Bar Chart Examples | Bar Graphs | Horizontal ...
- The most spoken languages of the world | Languages of South ...
- How to Create a Bar Chart in ConceptDraw PRO | Rainfall Bar Chart ...