"In the philosophy of language, a natural language (or ordinary language) is any language which arises in an unpremeditated fashion as the result of the innate facility for language possessed by the human intellect. A natural language is typically used for communication, and may be spoken, signed, or written. Natural language is distinguished from constructed languages and formal languages such as computer-programming languages or the "languages" used in the study of formal logic, especially mathematical logic. ... Though the exact definition varies between scholars, natural language can broadly be defined in contrast on the one hand to artificial or constructed languages, computer programming languages like Python and international auxiliary languages like Esperanto, and on the other hand to other communication systems in nature, such as the waggle dance of bees. Although there are a variety of natural languages, any cognitively normal human infant is able to learn any natural language. By comparing the different natural languages, scholars hope to learn something about the nature of human intelligence and the innate biases and constraints that shape natural language, which are sometimes called universal grammar. The term "natural language" refers only a language that has developed naturally, and hence to actual speech, rather than prescribed speech. Hence, unstandardized speech (such as African American Vernacular English) is natural, whereas standardized speech such as Standard American English, which is in part prescribed, is somewhat artificial." [Natural language. Wikipedia]
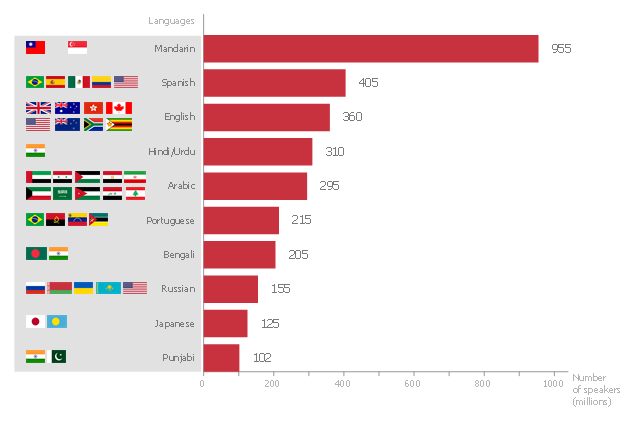
The horizontal bar chart example "The most spoken languages of the world" was created using the ConceptDraw PRO diagramming and vector drawing software extended with the Bar Graphs solution from the Graphs and Charts area of ConceptDraw Solution Park.
www.conceptdraw.com/ solution-park/ charts-bar-graphs
Horizontal bar graph
Bar Chart Software

"In the philosophy of language, a natural language (or ordinary language) is any language which arises in an unpremeditated fashion as the result of the innate facility for language possessed by the human intellect. A natural language is typically used for communication, and may be spoken, signed, or written. Natural language is distinguished from constructed languages and formal languages such as computer-programming languages or the "languages" used in the study of formal logic, especially mathematical logic. ... Though the exact definition varies between scholars, natural language can broadly be defined in contrast on the one hand to artificial or constructed languages, computer programming languages like Python and international auxiliary languages like Esperanto, and on the other hand to other communication systems in nature, such as the waggle dance of bees. Although there are a variety of natural languages, any cognitively normal human infant is able to learn any natural language. By comparing the different natural languages, scholars hope to learn something about the nature of human intelligence and the innate biases and constraints that shape natural language, which are sometimes called universal grammar. The term "natural language" refers only a language that has developed naturally, and hence to actual speech, rather than prescribed speech. Hence, unstandardized speech (such as African American Vernacular English) is natural, whereas standardized speech such as Standard American English, which is in part prescribed, is somewhat artificial." [Natural language. Wikipedia]
The horizontal bar chart example "The most spoken languages of the world" was created using the ConceptDraw PRO diagramming and vector drawing software extended with the Bar Graphs solution from the Graphs and Charts area of ConceptDraw Solution Park.
www.conceptdraw.com/ solution-park/ charts-bar-graphs
Horizontal bar graph
HelpDesk
How to Create a Bar Chart in ConceptDraw PRO

Bar charts are widely used to show and compare the values of the same parameters for different data groups.
The bar graph can be vertical or horizontal. This depends on the amount of categories. There are many methods in which bar graph can be built and this makes it a very often used chart type. Usually, a bar chart is created so that the bars are placed vertically. Such arrangement means that the bar's height value is proportional to the category value. Nevertheless, a bar chart can be also drawn horizontally. This means that the longer the bar, the bigger the category. Thus, a bar chart is a good way to present the relative values of different measured items. The ConceptDraw Bar Graphs solution allows you to draw a bar chart quickly using a vector library, containing the set of various bar charts objects.
The vector stencils library "Data-driven charts" contains 13 data-driven graphs and charts: area chart, divided bar diagram, double bar graph, frequency histogram, horizontal bar chart, line graph, percentage ring chart, percentage pie chart, scatter plot, column chart, waterfall chart.
Use it to visualize quantitative data in your data-driven infographics.
The graphs example "Data-driven charts - Vector stencils library" was created using the ConceptDraw PRO diagramming and vector graphics software extended with the Data-driven Infographics solution from the area "What is infographics" of ConceptDraw Solution Park.
Area chart

Divided bar diagram

Double bar graph

Frequency histogram

Horizontal bar graph

Line graph

Percentage ring chart

Pie chart

Percentage pie chart

Ring chart

Scatter plot

Column chart (vertical bar graph)
-data-driven-charts---vector-stencils-library.png--diagram-flowchart-example.png)
Waterfall chart

Bar Chart Examples

The vector stencils library "Data-driven charts" contains 13 data-driven graphs and charts: area chart, divided bar diagram, double bar graph, frequency histogram, horizontal bar chart, line graph, percentage ring chart, percentage pie chart, scatter plot, column chart, waterfall chart.
Use it to visualize quantitative data in your data-driven infographics.
The graphs example "Data-driven charts - Vector stencils library" was created using the ConceptDraw PRO diagramming and vector graphics software extended with the Data-driven Infographics solution from the area "What is infographics" of ConceptDraw Solution Park.
Use it to visualize quantitative data in your data-driven infographics.
The graphs example "Data-driven charts - Vector stencils library" was created using the ConceptDraw PRO diagramming and vector graphics software extended with the Data-driven Infographics solution from the area "What is infographics" of ConceptDraw Solution Park.
Area chart
Divided bar diagram
Double bar graph
Frequency histogram
Horizontal bar graph
Line graph
Percentage ring chart
Pie chart
Percentage pie chart
Ring chart
Scatter plot
Column chart (vertical bar graph)
Waterfall chart
Column Chart Software

The vector stencils library "Bar charts" contains 6 templates of bar and column charts for visualizing quantitative and statistical data comparison and changes in time series. Use these shapes to draw your bar graphs in the ConceptDraw PRO diagramming and vector drawing software extended with the Bar Graphs solution from the Graphs and Charts area of ConceptDraw Solution Park.
Vertical bar chart

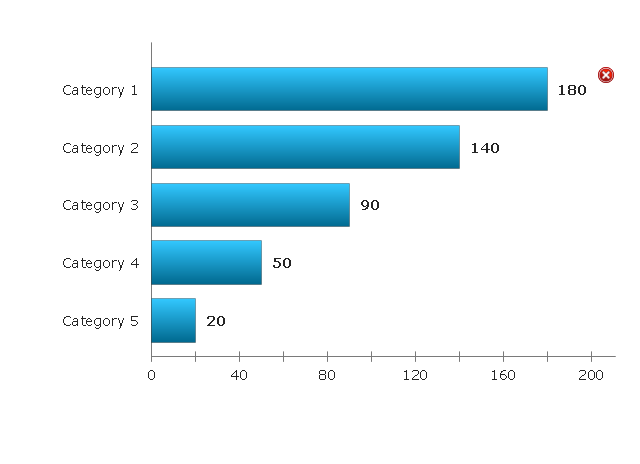
Horizontal bar chart

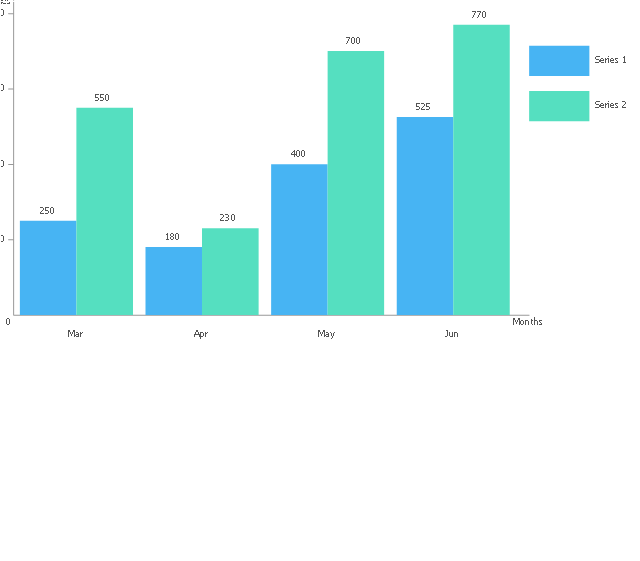
Double bar chart
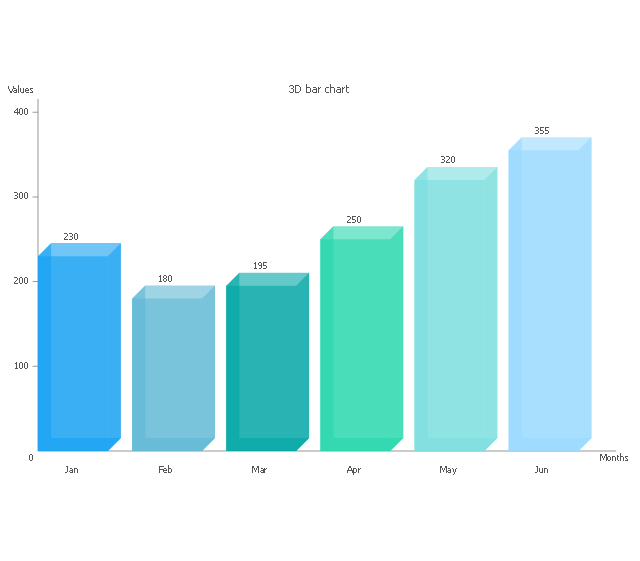
3D bar chart
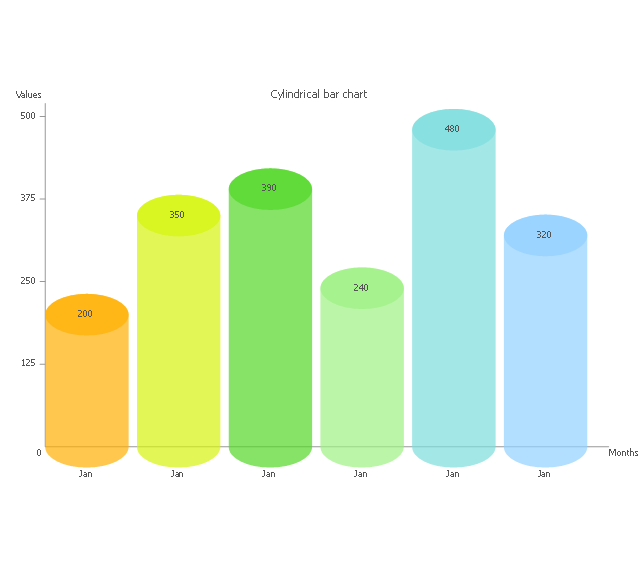
Cylindrical bar chart
Coordinate system 3D
Bar Graph

The vector stencils library "Education charts" contains 12 graphs and charts: area chart, column chart, divided bar diagram, histogram, horizontal bar graph, line graph, pie chart, ring chart, scatter plot.
Use it to create your education infogram in the ConceptDraw PRO diagramming and vector drawing software.
The vector stencils library "Education charts" is included in the Education Infographics solution from the Business Infographics area of ConceptDraw Solution Park.
Use it to create your education infogram in the ConceptDraw PRO diagramming and vector drawing software.
The vector stencils library "Education charts" is included in the Education Infographics solution from the Business Infographics area of ConceptDraw Solution Park.
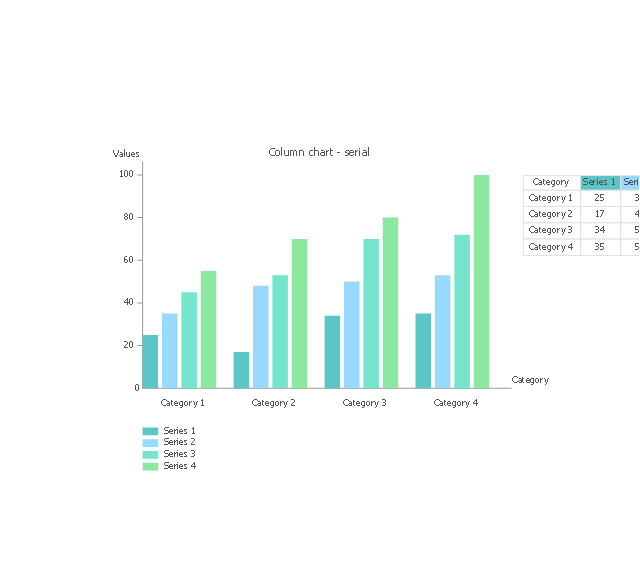
Area chart - serial

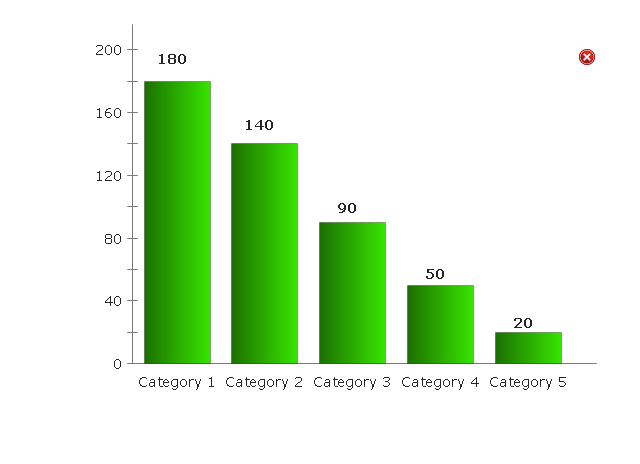
Column chart

Column chart - serial

Divided bar diagram

Frequency histogram

Horizontal bar chart

Horizontal bar chart - serial

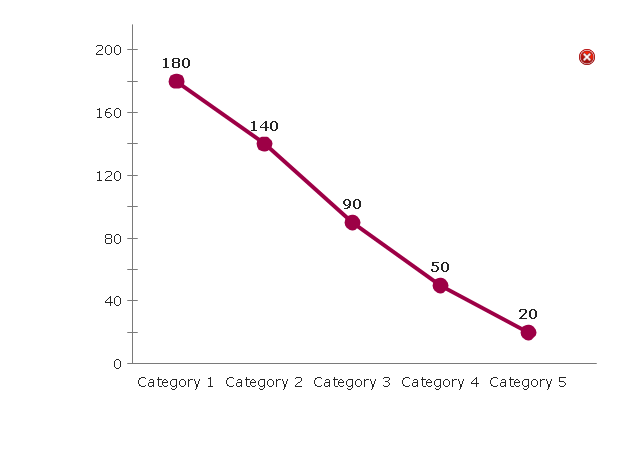
Line chart - serial

Pie chart

Ring chart

Scatter plot

Scatter plot - serial

The vector stencils library "Comparison charts" contains 4 Live Objects: Horizontal bar chart template, Column chart (Vertical bar chart) template, Line chart template and Dot plot (Scatter chart) template.
Use it for drawing visual dashboards in the ConceptDraw PRO diagramming and vector drawing software extended with the Comparison Dashboard solution from the area "What is a Dashboard" of ConceptDraw Solution Park.
www.conceptdraw.com/ solution-park/ comparison-dashboard
Use it for drawing visual dashboards in the ConceptDraw PRO diagramming and vector drawing software extended with the Comparison Dashboard solution from the area "What is a Dashboard" of ConceptDraw Solution Park.
www.conceptdraw.com/ solution-park/ comparison-dashboard
Horizontal Bar Chart
Column Chart
Line Chart
Dot Plot
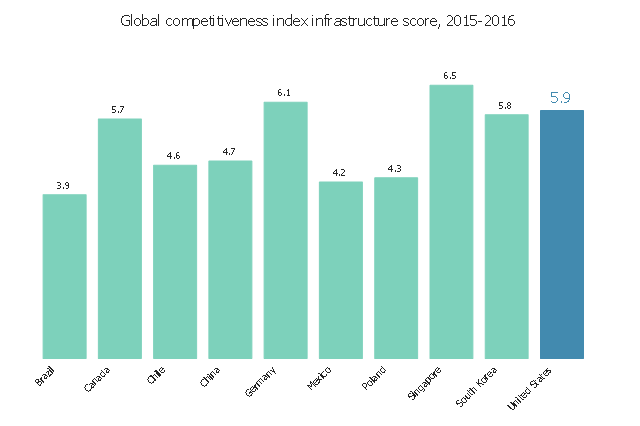
The example bar graph "Global competitiveness index infrastructure score chart, 2012-2013" was redesigned from the website "Assess Costs Everywhere" of the United States Department of Commerce. [acetool.commerce.gov/ shipping]
"The Global Competitiveness Report (GCR) is a yearly report published by the World Economic Forum. Since 2004, the Global Competitiveness Report ranks countries based on the Global Competitiveness Index, developed by Xavier Sala-i-Martin and Elsa V. Artadi. Before that, the macroeconomic ranks were based on Jeffrey Sachs's Growth Development Index and the microeconomic ranks were based on Michael Porter's Business Competitiveness Index. The Global Competitiveness Index integrates the macroeconomic and the micro/ business aspects of competitiveness into a single index." [Global Competitiveness Report. Wikipedia]
The example "Global competitiveness index infrastructure score chart, 2012-2013" was created using the ConceptDraw PRO diagramming and vector drawing software extended with the Bar Graphs solution from the Graphs and Charts area of ConceptDraw Solution Park.
www.conceptdraw.com/ solution-park/ charts-bar-graphs
Horizontal Bar Graph
Horizontal Org Flow Chart

The Organizational Chart is a diagram that shows the structure of the organization, different levels of management, hierarchy and the relationships of the organization parts.
The vector stencils library "Education charts" contains 12 graphs and charts: area chart, column chart, divided bar diagram, histogram, horizontal bar graph, line graph, pie chart, ring chart, scatter plot.
Use it to create your educational infograms.
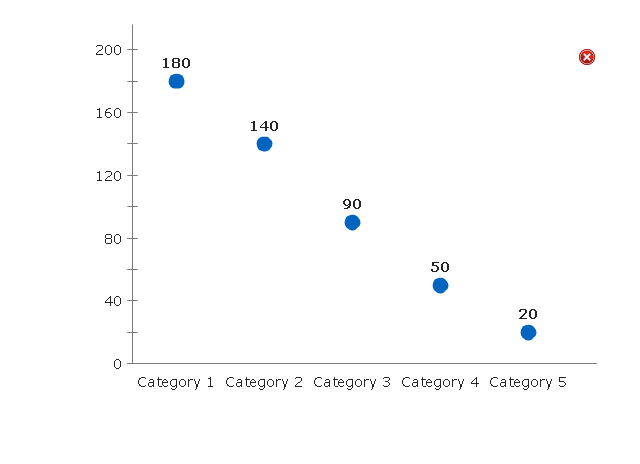
"A chart can take a large variety of forms, however there are common features that provide the chart with its ability to extract meaning from data.
Typically the data in a chart is represented graphically, since humans are generally able to infer meaning from pictures quicker than from text. Text is generally used only to annotate the data.
One of the more important uses of text in a graph is the title. A graph's title usually appears above the main graphic and provides a succinct description of what the data in the graph refers to.
Dimensions in the data are often displayed on axes. If a horizontal and a vertical axis are used, they are usually referred to as the x-axis and y-axis respectively. Each axis will have a scale, denoted by periodic graduations and usually accompanied by numerical or categorical indications. Each axis will typically also have a label displayed outside or beside it, briefly describing the dimension represented. If the scale is numerical, the label will often be suffixed with the unit of that scale in parentheses. ...
The data of a chart can appear in all manner of formats, and may include individual textual labels describing the datum associated with the indicated position in the chart. The data may appear as dots or shapes, connected or unconnected, and in any combination of colors and patterns. Inferences or points of interest can be overlaid directly on the graph to further aid information extraction.
When the data appearing in a chart contains multiple variables, the chart may include a legend (also known as a key). A legend contains a list of the variables appearing in the chart and an example of their appearance. This information allows the data from each variable to be identified in the chart." [Chart. Wikipedia]
The shapes example "Design elements - Education charts" was created using the ConceptDraw PRO diagramming and vector drawing software extended with the Education Infographics solition from the area "Business Infographics" in ConceptDraw Solution Park.
Use it to create your educational infograms.
"A chart can take a large variety of forms, however there are common features that provide the chart with its ability to extract meaning from data.
Typically the data in a chart is represented graphically, since humans are generally able to infer meaning from pictures quicker than from text. Text is generally used only to annotate the data.
One of the more important uses of text in a graph is the title. A graph's title usually appears above the main graphic and provides a succinct description of what the data in the graph refers to.
Dimensions in the data are often displayed on axes. If a horizontal and a vertical axis are used, they are usually referred to as the x-axis and y-axis respectively. Each axis will have a scale, denoted by periodic graduations and usually accompanied by numerical or categorical indications. Each axis will typically also have a label displayed outside or beside it, briefly describing the dimension represented. If the scale is numerical, the label will often be suffixed with the unit of that scale in parentheses. ...
The data of a chart can appear in all manner of formats, and may include individual textual labels describing the datum associated with the indicated position in the chart. The data may appear as dots or shapes, connected or unconnected, and in any combination of colors and patterns. Inferences or points of interest can be overlaid directly on the graph to further aid information extraction.
When the data appearing in a chart contains multiple variables, the chart may include a legend (also known as a key). A legend contains a list of the variables appearing in the chart and an example of their appearance. This information allows the data from each variable to be identified in the chart." [Chart. Wikipedia]
The shapes example "Design elements - Education charts" was created using the ConceptDraw PRO diagramming and vector drawing software extended with the Education Infographics solition from the area "Business Infographics" in ConceptDraw Solution Park.
Graphs and charts

- Horizontal bar chart - The most spoken languages of the world ...
- Bar Graphs | Bar Graph | Double bar graph - Template | _bar Graph_
- Double bar graph - Template
- Horizontal bar chart - The most spoken languages of the world | Bar ...
- Bar Chart Template for Word | Sales Growth. Bar Graphs Example ...
- Horizontal bar chart - The most spoken languages of the world ...
- Bar Chart Examples | Rainfall Bar Chart | How to Create a Bar Chart ...
- Horizontal bar chart - The most spoken languages of the world ...
- Bar Chart Software | Bar Graphs | Chart Maker for Presentations ...
- Horizontal bar chart - The most spoken languages of the world
- Business Bar Graph
- Bar Chart Template for Word | Column Chart Template | Chart Maker ...
- Sales Growth. Bar Graphs Example | Bar Graph | Bar charts - Vector ...
- Bar Chart Software | Chart Maker for Presentations | Data-driven ...
- How to Create a Bar Chart in ConceptDraw PRO | Bar Chart ...
- Double bar graph - Template | Bar Chart Software | Nitrate ...
- Bar Graph | Bar Chart Software | Column Chart Software | Design A ...
- Bar Chart Template for Word | Bar Chart Examples | How to Create a ...
- Bar Graph Comparison
- Bar Graph | Cross-Functional Flowchart (Swim Lanes) | Swim Lane ...