This site uses cookies. By continuing to browse the ConceptDraw site you are agreeing to our Use of Site Cookies.

Data Flow Diagram Software

When studying a business process or system that involves the transfer of data, it is common to use a data flow diagram (DFD) to visualize how that data is processed. While initially used exclusively in regards to the flow of data through a computer system, DFDs are now employed as a business modelling tool, describing business events and interactions, or physical systems involving data storage and transfer.
ConceptDraw DIAGRAM is a powerful Data Flow Diagram Software thanks to the Data Flow Diagrams solution from the Software Development area of ConceptDraw Solution Park.
You can use the predesigned DFD vector objects that are grouped in 3 libraries of Data Flow Diagrams solution: Data Flow Diagrams Library; Gane-Sarson Notation Library; Yourdon and Coad Notation Library.

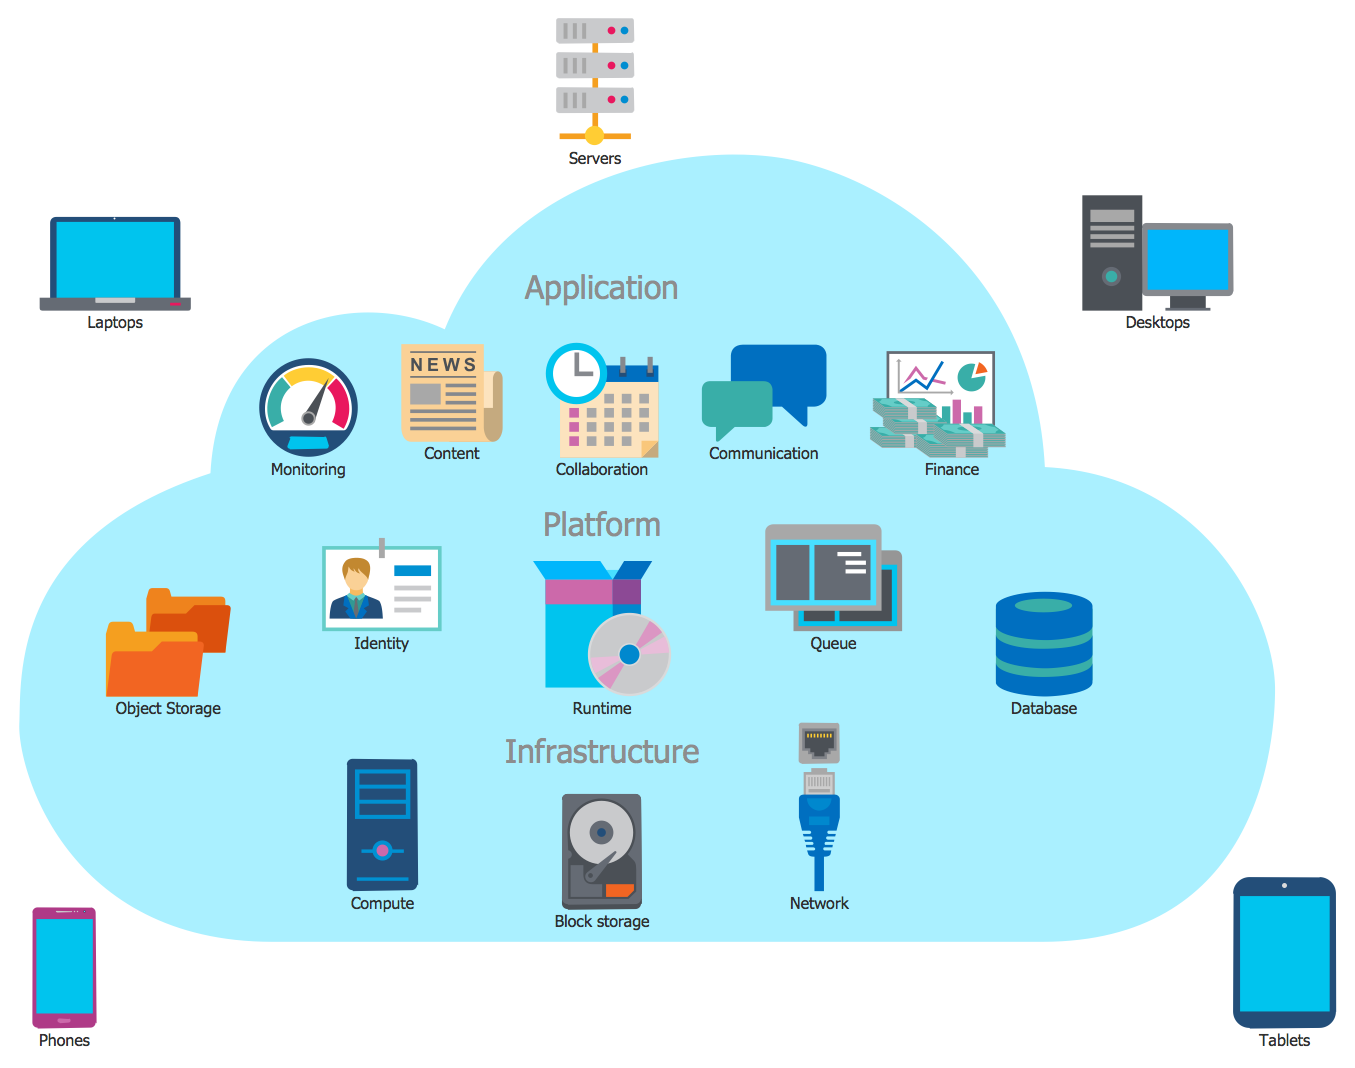
Cloud Computing Architecture Diagrams

For documenting the Cloud Computing Architecture with a goal to facilitate the communication between stakeholders are successfully used the Cloud Computing Architecture diagrams. It is convenient and easy to draw various Cloud Computing Architecture diagrams in ConceptDraw DIAGRAM software with help of tools of the Cloud Computing Diagrams Solution from the Computer and Networks Area of ConceptDraw Solution Park.

data flow diagram, DFD templates 
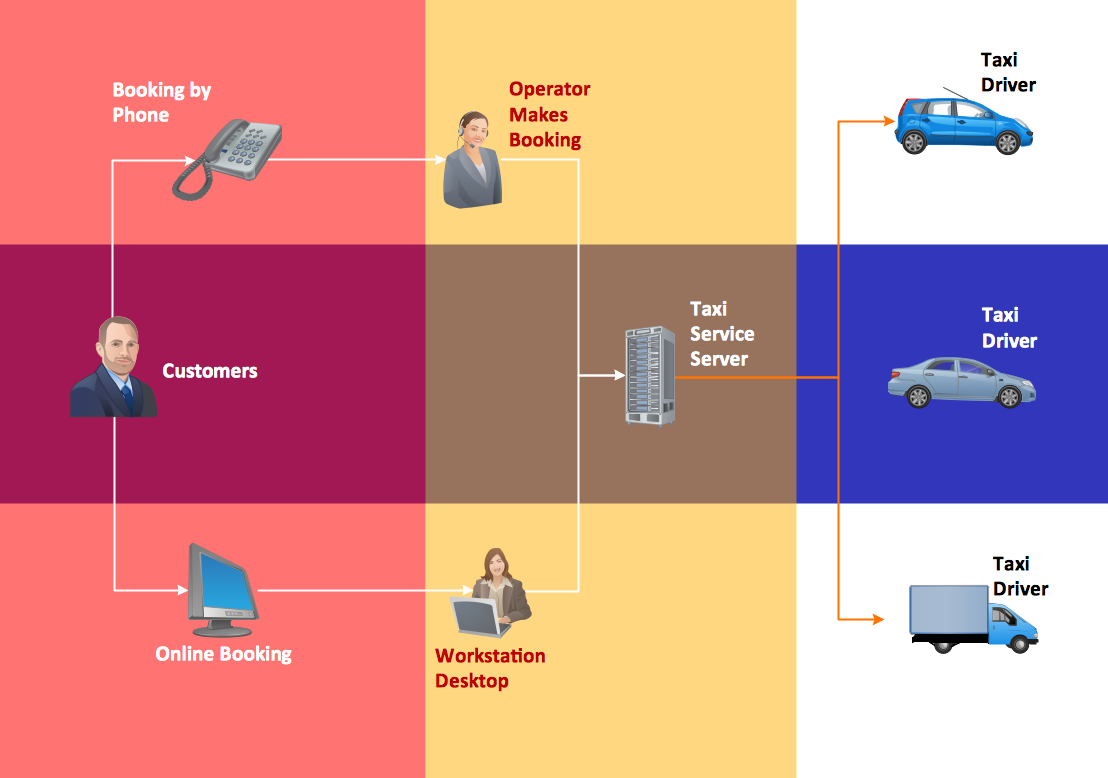
Data Flow Diagrams (DFD)

data flow diagram, DFD templates
Data Flow Diagrams solution extends ConceptDraw DIAGRAM software with templates, samples and libraries of vector stencils for drawing the data flow diagrams (DFD).

Cloud Computing Architecture

The Cloud Computing Architecture is the structure of the system, which is based on the needs of end-user and includes the set of components and subcomponents required for cloud computing, among them cloud resources, services, middleware, software components, front-end platforms (cloud clients), cloud-based back end platforms (servers, storage), and a network (Internet, Intranet, Intercloud). When designing the Cloud Computing Architecture diagrams, the ConceptDraw DIAGRAM diagramming and vector drawing software advises to turn attention for the powerful Cloud Computing Diagrams solution from the extensive Computers and Network area of ConceptDraw Solution Park.

ConceptDraw DIAGRAM ER Diagram Tool
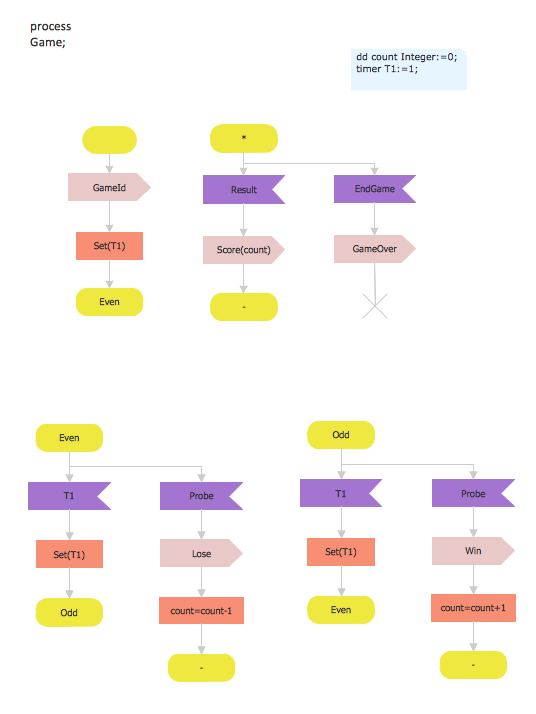
ER-diagram is a tool used for database modeling which allows to determine data and relationships among the data. These diagrams help to detail data storages and to document all the properties of designed system. ER-diagram contains entities, attributes of the entities and the relationships between them. Chen’s notation and Crow’s foot notation are commonly used to represent elements in ER-model. To create such diagram you should use specific software, such as Entity-Relationship Diagram solution for ConceptDraw DIAGRAM.
ConceptDraw ER Diagram Tool works across any platform, meaning you never have to worry about compatibility again. ConceptDraw DIAGRAM allows you to make Entity-Relationship Diagram (ERD) on PC or macOS operating systems.

SDL Diagram

Specification and Description Language (SDL) is used for creating the object-oriented diagrams, visualizing the processes of the state machines for the systems of communication, telecommunication, automotive, aviation and medical industries. SDL is a specification language for creating specifications, descriptions of the behavior, data, and inheritance for real-time systems.
This sample shows the SDL Diagram of the process game.

How To Create a Workflow Diagram

A workflow diagram is less general notation than a process flow diagram. Workflow as a term can apply to organizational process which involves people, resources, documents, sort of data, for instance; whereas a process is general collection of steps occuring in any sort of activity. That is why process flow diagram can be used as workflow diagram to describe business process, data flow or department interactions.

The fastest way to create a workflow diagram is using pre-designed workflow template. ConceptDraw DIAGRAM with the Workflow Diagrams solution delivers rich set of workflow diagram templates you may start from.

Cross Functional Flowchart Symbols

The excellent possibility to create attractive Cross Functional Flowcharts for step-by-step visualization the operations of a business process flow of any degree of detailing is offered by ConceptDraw’s Cross-Functional Flowcharts solution. The extensive selection of commonly used vector cross functional flowchart symbols allow you to demonstrate the document flow in organization, to represent each team member’s responsibilities and how processes get shared or transferred between different teams and departments.

Amazon Web Services Diagrams diagramming tool for architecture

The AWS Architecture Diagrams solution includes icons, sample and templates for several Amazon Web Services products and resources, to be used when creating architecture diagrams. The icons are designed to be simple so that you can easily incorporate them in your diagrams and put them in your whitepapers, presentations, datasheets, posters or any technical material you like. Here you will find an official collection of AWS resources that will help you build great AWS Architecture diagrams.

Flow Chart Symbols

Flowcharts are used in designing and documenting simple processes or programs. Like other types of diagrams, they help visualize what is going on and thereby help understand a process, and perhaps also find flaws, bottlenecks, and other less-obvious features within it. There are many different types of flowcharts, and each type has its own repertoire of boxes and notational conventions.
Flowchart diagrams consists of symbols of process, decision, data and document, data base, termination or initiation processes, processing loops and conditions. To create an drawn flowchart use professional flowchart maker of ConceptDraw DIAGRAM.