This site uses cookies. By continuing to browse the ConceptDraw site you are agreeing to our Use of Site Cookies.

Software Diagram Examples and Templates

ConceptDraw DIAGRAM is a powerful tool for business and technical diagramming.
Software Development area of ConceptDraw Solution Park provides 5 solutions:
Data Flow Diagrams, Entity-Relationship Diagram (ERD), Graphic User Interface, IDEFO Diagrams, Rapid UML.

Sales Process Management

Sales process management is a business discipline which focuses on the development and practical application of various sales techniques, and on the management of sales operations of the company.

It is effective to use professional software for the sales process management. ConceptDraw DIAGRAM diagramming and vector drawing software extended with Sales Flowcharts solution from the Marketing area of ConceptDraw Solution Park is the best choice.

Flow chart Example. Warehouse Flowchart

Warehouse Flowcharts are different diagrams describing wharehousing and inventory menagement processes. Typical purposes of warehouse flowcharts are evaluating warehouse performance and organizational performance, measuring efficiency of customer service. This type of workflow diagrams can be used for identifying any disconnection between business activities and business objectives.
Standard warehousing process flow diagram and standard workflow diagram used for process identification for further evaluating effectiveness and profitability of overall business process. Use the ConceptDraw DIAGRAM diagramming and vector drawing software extended with the Flowcharts solution from the Diagrams area of ConceptDraw Solution Park to design your own workflow diagrams, process flow diagram and flow charts. Need to use Process Flow Diagram for designing Warehouse packages flow.
ConceptDraw Arrows10 Technology

Data Flow Diagram (DFD)

This example is created using ConceptDraw DIAGRAM enhanced with solution Data Flow Diagrams. This diagram shows one of the business processes to simplify and accelerate understanding, analysis, and representation.

DFD Library — Design elements

Three DFD libraries, 49 vector shapes. Use these DFD symbol libraries to design the process-oriented models, data-oriented models, data flowcharts, data process diagrams, structured analysis diagrams, and information flow diagrams.

Yourdon and Coad Diagram

The vector stencils library Yourdon and Coad Notation from the solution OOAD contains specific symbols of the Yourdon and Coad notation such as data store symbol, data process symbol, loop symbol for ConceptDraw DIAGRAM diagramming and vector drawing software. The OOAD solution is contained in the Software Development area of ConceptDraw Solution Park.

Structured Systems Analysis and Design Method (SSADM) with ConceptDraw DIAGRAM
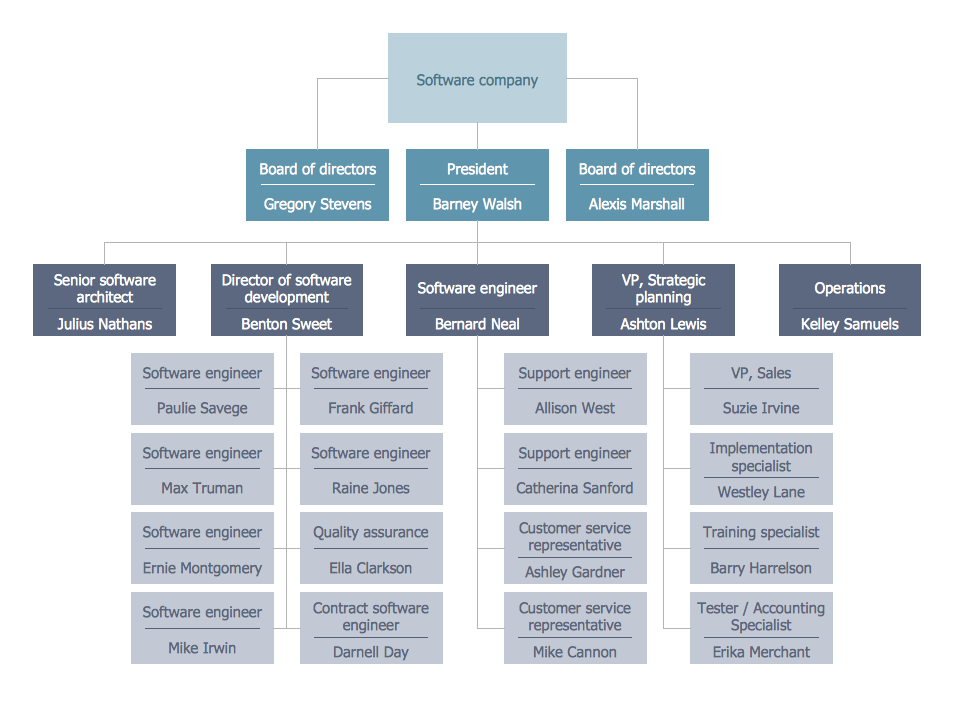
Structured Systems Analysis and Design Method SSADM is the method which is used at projecting and analysis of information systems. SSADM is based on the data flow diagrams. At the description of data flows out of the system and into the system DFD, which denote boundaries of the system, are used.

Business Structure

Each business is created, exists and develops according to its type of business structure. Creating new business or developing existing, you may need a powerful software for representing its business structure. In this case ConceptDraw DIAGRAM diagramming and vector drawing software extended with 25 Typical Orgcharts solution from the Management area is exactly what you need.

data flow diagram, DFD templates Data Flow Diagrams (DFD)

data flow diagram, DFD templates
Data Flow Diagrams solution extends ConceptDraw DIAGRAM software with templates, samples and libraries of vector stencils for drawing the data flow diagrams (DFD).

Cross-Functional Flowchart

Cross-Functional Flowchart - to draw cross functional process maps is by starting with a cross-functional flowchart samples and templates. Easy to draw sample cross functional Process Flow Diagrams. Using a Cross-Functional flowchart is a clear way of showing each team member’s responsibilities and how processes get shared or transferred between different teams and departments.
Use cross-functional flowcharts to show the relationship between a business process and the functional units (such as departments) responsible for that process. To create it use the best flowchart maker of ConceptDraw DIAGRAM.
How to Draw a Cross Functional Flowchart using visio alternative ConceptDraw DIAGRAM as visio for mac