"BPM life-cycle.
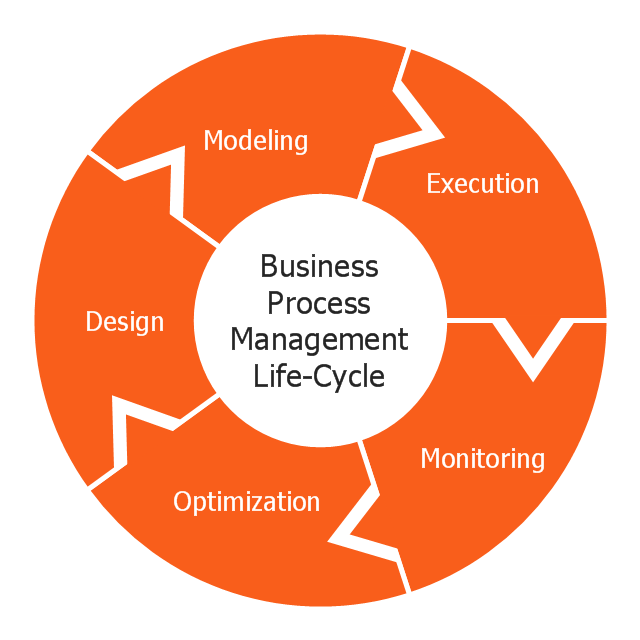
Business process management activities can be grouped into six categories: vision, design, modeling, execution, monitoring, and optimization.
Functions are designed around the strategic vision and goals of an organization. Each function is attached with a list of processes. Each functional head in an organization is responsible for certain sets of processes made up of tasks which are to be executed and reported as planned. Multiple processes are aggregated to function accomplishments and multiple functions are aggregated to achieve organizational goals." [Business process management. Wikipedia]
This business process management life cycle diagram example was redesigned using the ConceptDraw PRO diagramming and vector drawing software from the Wikipedia file: Business Process Management Life-Cycle.svg. [en.wikipedia.org/ wiki/ File:Business_ Process_ Management_ Life-Cycle.svg]
This file is licensed under the Creative Commons Attribution-Share Alike 3.0 Unported license. [creativecommons.org/ licenses/ by-sa/ 3.0/ deed.en]
The circular arrows diagram example "BPM life cycle" is included in the Circular Arrows Diagrams solution from the area "What is a Diagram" of ConceptDraw Solution Park.
Circular arrows diagram
 Circular Arrows Diagrams
Circular Arrows Diagrams solution extends ConceptDraw PRO v10 with extensive drawing tools, predesigned samples, Circular flow diagram template for quick start, and a library of ready circular arrow vector stencils for drawing Circular Arrow Diagrams, Segmented Cycle Diagrams, and Circular Flow Diagrams. The elements in this solution help managers, analysts, business advisers, marketing experts, scientists, lecturers, and other knowledge workers in their daily work.
Basic Diagramming


Pie Chart Examples and Templates

Pie chart examples and templates created using ConceptDraw PRO software helps you get closer with pie charts and find pie chart examples suite your needs.
- Arrow circle chart template | Circular Arrows Diagrams | Circular ...
- Circular Arrows Diagrams | Circular arrows diagram - Quality cycle
- Circular arrows diagram - Business process life cycle | Basic ...
- Circular arrows diagram - Business process life cycle | Circular ...
- Circular Arrows Diagrams | Circular arrows diagram - Quality cycle
- Circular arrows diagram - Quality cycle | Water cycle diagram ...
- Arrow circle chart template | Circular Arrows Diagrams | Circular ...
- Circular arrows diagram
- Process Flowchart | Basic Flowchart Symbols | Circular Arrows ...
- Flowchart - Product life cycle process | Circular arrows diagram ...
- Circular Arrows Diagrams | Target and Circular Diagrams | Basic ...
- Arrow circle chart template | Basic Diagramming | Circular Arrows ...
- Circular arrows diagram - Quality cycle | Citric acid cycle (TCA cycle ...
- Design elements - IDEF0 diagram | Arrow circle chart template ...
- Program to Make Flow Chart | Drawing Illustration | Water cycle ...
- Circular arrows diagram - Quality cycle | Design elements ...
- Flowchart - Product life cycle process | Draw Flowcharts with ...
- Arrow circle chart template |
- Rapid UML | Business Process Diagram | Circular Arrows Diagrams |
- Basic Diagramming | Arrow circle chart template | Best Diagramming |