Use this column chart template to design your vertical bar graphs in the ConceptDraw PRO diagramming and vector drawing software.
"Bar charts have a discrete range. Bar charts are usually scaled so all the data can fit on the chart. Bars on the chart may be arranged in any order. Bar charts arranged from highest to lowest incidence are called Pareto charts. Normally, bars showing frequency will be arranged in chronological (time) sequence. Grouped bar graph usually present the information in the same order in each grouping. Stacked bar graphs present the information in the same sequence on each bar.
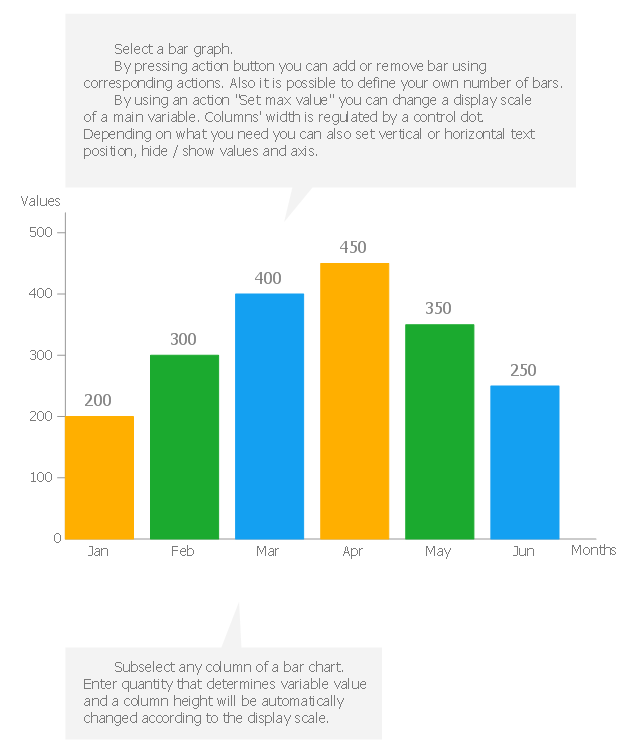
Bar charts provide a visual presentation of categorical data. Categorical data is a grouping of data into discrete groups, such as months of the year, age group, shoe sizes, and animals. These categories are usually qualitative. In a column bar chart, the categories appear along the horizontal axis; the height of the bar corresponds to the value of each category." [Bar chart. Wikipedia]
The bar graph template "Bar chart" is included in the Basic Bar Graphs solution from the Graphs and Charts area of ConceptDraw Solution Park.
"Bar charts have a discrete range. Bar charts are usually scaled so all the data can fit on the chart. Bars on the chart may be arranged in any order. Bar charts arranged from highest to lowest incidence are called Pareto charts. Normally, bars showing frequency will be arranged in chronological (time) sequence. Grouped bar graph usually present the information in the same order in each grouping. Stacked bar graphs present the information in the same sequence on each bar.
Bar charts provide a visual presentation of categorical data. Categorical data is a grouping of data into discrete groups, such as months of the year, age group, shoe sizes, and animals. These categories are usually qualitative. In a column bar chart, the categories appear along the horizontal axis; the height of the bar corresponds to the value of each category." [Bar chart. Wikipedia]
The bar graph template "Bar chart" is included in the Basic Bar Graphs solution from the Graphs and Charts area of ConceptDraw Solution Park.
Template
Bar Chart Template for Word

Column Chart Examples

 Timeline Diagrams
Timeline Diagrams solution extends ConceptDraw PRO software with templates, samples and library of vector stencils for drawing the timeline and milestones diagrams.
Competitor Analysis

Line Chart Examples

Chart Examples

Basic Diagramming


HelpDesk
How to Create a Timeline Diagram in ConceptDraw PRO

Scatter Chart Examples

 Management Area
The solutions from Management area of ConceptDraw Solution Park collect templates, samples and libraries of vector stencils for drawing the management diagrams and mind maps.
How to Draw EPC Diagram Quickly
Diagram (Win, Mac)")

An Event-driven Process Chain (EPC) - flowchart used for business process modelling
 flowchart used for business process modelling")
 ATM UML Diagrams
The ATM UML Diagrams solution lets you create ATM solutions and UML examples. Use ConceptDraw PRO as a UML diagram creator to visualize a banking system.
The Building Blocks Used in EPC Diagrams
")
- Chronological Bar Graph
- What Is A Chronological Bar Chart
- How to Make a Timeline | Bar chart - Template | Project Timeline ...
- Bar Diagram Of Chronological Chart
- Double bar graph - Template
- Line Chart For Chronological
- Bar Graphs | Bar chart - Template | Frequency Distribution ...
- Bar chart - Template | Bar Diagrams for Problem Solving. Create ...
- Bar chart - Template | Process Flowchart | Basic Flowchart Symbols ...
- Line graph - Template | Bar chart - Template | Process Flowchart ...
- Bar Chart Template for Word | Double bar graph - Template | Bar ...
- Bar Chart Template for Word | Double bar graph - Template | Chart ...
- How to Create a Bar Chart in ConceptDraw PRO | Bar Chart ...
- Bar Graph | Beautiful Stacked Bar Charts
- Bar Chart Template for Word | Column Chart Template | Chart Maker ...
- Chronological Order Vector
- Timeline Diagrams | How to Create a Timeline Diagram in ...
- Chronological About Online Shopping Process
- Chart Examples | Chart Templates | Recent Bar Graph On Crime ...