How to Make a Timeline

Project Timeline

Timeline Examples

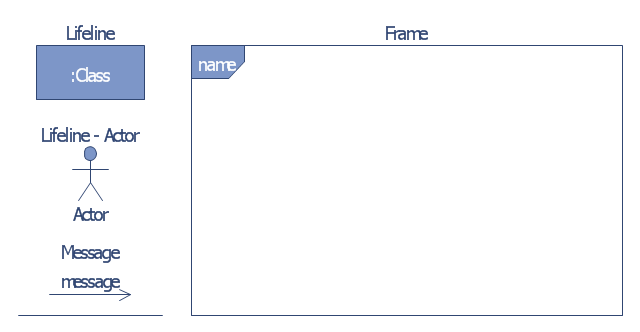
The vector stencils library "Bank UML communication diagram" contains 4 shapes for drawing UML communication (collaboration) diagrams.
Use it for object-oriented modeling of your bank information system.
"A communication diagram in the Unified Modeling Language (UML) 2.0, is a simplified version of the UML 1.x collaboration diagram.
A Communication diagram models the interactions between objects or parts in terms of sequenced messages. Communication diagrams represent a combination of information taken from Class, Sequence, and Use Case Diagrams describing both the static structure and dynamic behavior of a system.
However, communication diagrams use the free-form arrangement of objects and links as used in Object diagrams. In order to maintain the ordering of messages in such a free-form diagram, messages are labeled with a chronological number and placed near the link the message is sent over. Reading a communication diagram involves starting at message 1.0, and following the messages from object to object." [Communication diagram. Wikipedia]
This example of UML communication diagram symbols for the ConceptDraw PRO diagramming and vector drawing software is included in the ATM UML Diagrams solution from the Software Development area of ConceptDraw Solution Park.
UML communication diagram symbols
Cross Functional Diagram

Sample Pictorial Chart. Sample Infographics

HelpDesk
How to Create a Timeline Diagram

Bar Chart Examples

Flow Diagrams

Context Diagram Template

This template shows the Context Diagram. It was created in ConceptDraw DIAGRAM diagramming and vector drawing software using the Block Diagrams Solution from the “Diagrams” area of ConceptDraw Solution Park. The context diagram graphically identifies the system. external factors, and relations between them. It’s a high level view of the system. The context diagrams are widely used in software engineering and systems engineering for designing the systems that process the information.
- Chronological Bar Chart
- Timeline Vector Graphic
- Sequence Diagram Application
- UML Collaboration Diagram. Design Elements | UML Sequence ...
- Symbols Used In A Communication Diagram
- Project management - Vector stencils library | Schedule pie chart ...
- Create A Vector Timeline
- Order processing center - UML sequence diagram | UML sequence ...
- Timeline Examples | Project Timeline | Timeline Diagrams | Visio ...
- Difference Between Flow Chart And Vector Diagram