Workflow Diagram Software

BPM Software

How to Present Workflow to Team

How To Organize Response Process

Copying Service Process Flowchart.Flowchart Examples

Draw Flowcharts with ConceptDraw

UML Business Process

Create Organizational Chart

BPR Diagram. Business Process Reengineering Example

How to Build a Flowchart

Business Process Workflow Diagrams & Software


Value Stream Mapping for the Lean Office

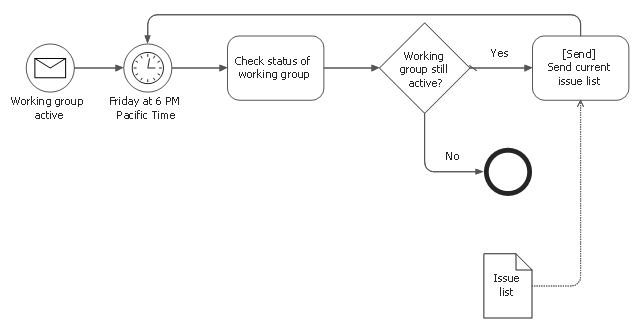
This BPMN diagram sample was designed on the base of the Wikimedia Commons file: BPMN-AProcesswithNormalFlow.svg. [commons.wikimedia.org/ wiki/ File:BPMN-AProcesswithNormalFlow.svg]
"Business process modelling (BPM) is the activity of representing processes of an enterprise, so that the current ("as is") process may be analyzed and improved in future ("to be"). Business process modelling is typically performed by business analysts and managers who are seeking to improve process efficiency and quality. The process improvements identified by business process modelling may or may not require Information Technology involvement, although that is a common driver for the need to model a business process, by creating a process master.
Change management programs are typically involved to put the improved business processes into practice. With advances in technology from large platform vendors, the vision of business process modelling models becoming fully executable (and capable of simulations and round-trip engineering) is coming closer to reality every day." [Enterprise modelling. Wikipedia]
The business process diagram example "A process with normal flow" was created using the ConceptDraw PRO diagramming and vector drawing software extended with the Business Process Model and Notation solution from the Business Processes area of ConceptDraw Solution Park.
BPMN diagram
How to Draw EPC Diagram Quickly


Authority Matrix Diagram Software

Cisco Media. Cisco icons, shapes, stencils and symbols

 Workflow Diagrams
Evaluate all advantages of workflow diagram software ConceptDraw DIAGRAM extended with the Workflow Diagrams solution that includes workflow examples and samples, workflow diagram template, a library of workflow diagram symbols and pictorial vector clipart for drawing visual and intuitively understandable Workflow diagrams. Design pictorial Work flow chart or Work flow diagram easier than ever, use them for documentation and implementation purposes, export in a variety of common graphics formats and share with colleagues. Extend the already wide area Work flow diagrams' applications that are used today in the manufacturing industry, software development, HR, medicine, banking and finance sphere, education, military, government, business, e-commerce, and many other fields.
Process Flow Chart Examples

 Seven Management and Planning Tools
Seven Management and Planning Tools solution extends ConceptDraw DIAGRAM and ConceptDraw MINDMAP with features, templates, samples and libraries of vector stencils for drawing management mind maps and diagrams.
- Process Flowchart | Pyramid Diagram | Change Management
- Project —Task Trees and Dependencies | Managing the task list ...
- SWOT and TOWS Matrix Diagrams | SWOT Analysis Software ...
- Gantt charts for planning and scheduling projects | What is Gantt ...
- TQM Tools | 4m Change Management Format
- Total Quality Management with ConceptDraw | 4m Change Meaning
- Swim Lane Diagrams | Cross-Functional Process Map Template ...
- Total Quality Management Value | Quality Management Tools ...
- Mind Map Making Software | Change Management Mind Map
- Management Tools — Total Quality Management | Relationships ...