This site uses cookies. By continuing to browse the ConceptDraw site you are agreeing to our Use of Site Cookies.

Data structure diagram with ConceptDraw DIAGRAM

Data structure diagram (DSD) is intended for description of conceptual models of data (concepts and connections between them) in the graphic format for more obviousness. Data structure diagram includes entities description, connections between them and obligatory conditions and requirements which connect them. Create Data structure diagram with ConceptDraw DIAGRAM.

MS Visio Look a Like Diagrams

No need for any special drawing skills to create professional looking diagrams outside of your knowledge base. ConceptDraw DIAGRAM takes care of the technical details, allowing you to focus on your job, not the drawing.
ConceptDraw DIAGRAM delivers full-functioned alternative to MS Visio. ConceptDraw DIAGRAM supports import of Visio files. ConceptDraw DIAGRAM supports flowcharting, swimlane, orgchart, project chart, mind map, decision tree, cause and effect, charts and graphs, and many other diagram types.

ConceptDraw DIAGRAM Network Diagram Tool

With ConceptDraw DIAGRAM you can diagram a network or create a computer network diagram using specialized libraries of network components such as computers, hubs, smart connectors etc. that simulate network design topologies and devices, network architectures (all these shapes are parts of network diagram tool ConceptDraw DIAGRAM).
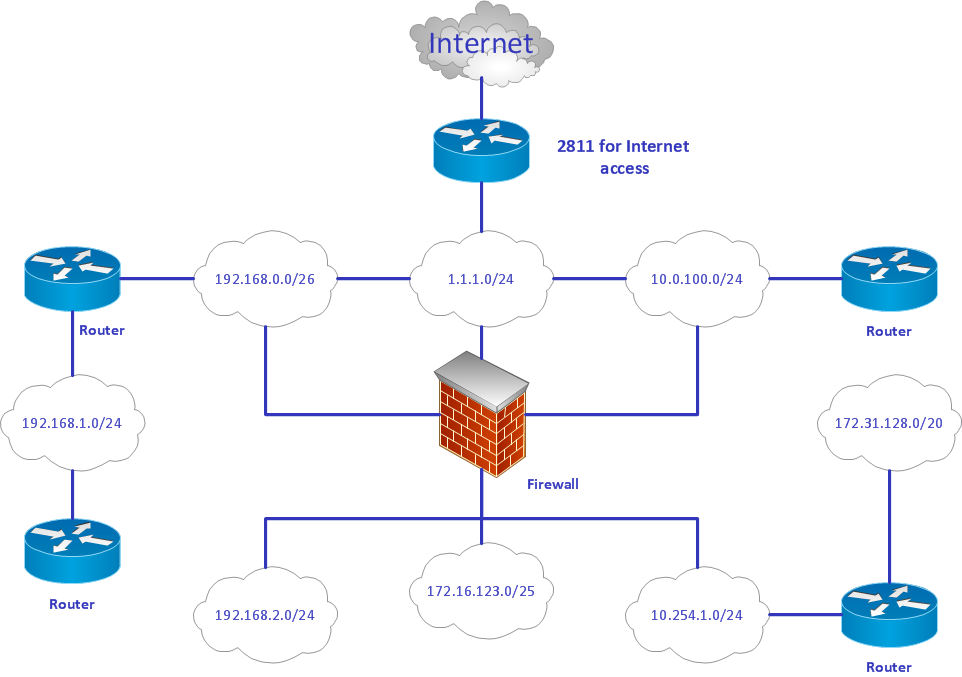
Create Network Topology Diagram

ER Diagram for Cloud Computing

The entity–relationship (ER) model is a data model that lets graphically represent the information system and depict the relationships between people, objects, concepts, places, and events within a given system. It is also convenient to use the ER Diagram for Cloud computing representation and description the Cloud computing architecture, design them with pleasure using the extensive tools of the Cloud Computing Diagrams solution from the Computers and Network area of ConceptDraw Solution Park.

Entity Relationship Diagram Examples

Create an Entity-Relationship (ER) model is to visually represent the structure of a business database, where data equates to entities (or objects) that are linked by defined relationships expressing dependencies and requirements. By nature it is an abstract visualization, the first step in the design process towards creating a logical and functional database.

ConceptDraw DIAGRAM diagramming and vector drawing software gives the ability to describe a database using the Entity-Relationship model. Entity-Relationship Diagram(ERD) solution from the Software Development area supplies the ConceptDraw DIAGRAM with icons advocated by Chen's and Crow’s Foot notation that can be used when describing a database.
How to Build an Entity Relationship Diagram (ERD)

Design Element: Basic Network for Network Diagrams

ConceptDraw DIAGRAM is perfect for software designers and software developers who need to draw Basic Network Diagrams.

UML Composite Structure Diagram. Design Elements

UML Composite Structure Diagram shows the internal structure of a class and the possible interactions at this structure.
ConceptDraw has 393 vector stencils in the 13 libraries that helps you to start using software for designing your own UML Diagrams. You can use the appropriate stencils of UML notation from UML Composite Structure library.

ERD Symbols and Meanings

Crow's foot notation is used in Barker's Notation, Structured Systems Analysis and Design Method (SSADM) and information engineering. Crow's foot diagrams represent entities as boxes, and relationships as lines between the boxes. Different shapes at the ends of these lines represent the cardinality of the relationship.
The Chen's ERD notation is still used and is considered to present a more detailed way of representing entities and relationships.
To create an ERD, software engineers mainly turn to dedicated drawing software, which contain the full notation resources for their specific database design - ERD symbols and meanings. CS Odessa has released an all-inclusive Entity-Relationship Diagram (ERD) solution for their powerful drawing program, ConceptDraw DIAGRAM.
How to Build an Entity Relationship Diagram (ERD)

Produce Professional Diagrams More Quickly, Easily and Cost Effectively

ConceptDraw Arrows10 Technology - This is more than enough versatility to produce professional diagrams more quickly.

Professional diagramming software for mac helps you create variety diagrams, graphics, charts, live dashboards and plenty of graphics and pictures for your business and study.

Network Visualization with ConceptDraw DIAGRAM

ConceptDraw makes the entire process of network visualization easier thanks to the numerous ready-to-use objects included in the package for presentation of network equipment, LDAP directory symbols and many other objects that symbolize resources in most various representations.