Flowchart design. Flowchart symbols, shapes, stencils and icons


This cycle process chart was redesigned from the Wikimedia Commons file: Business Feedback Loop PNG version.png.
"A business ideally is continually seeking feedback from customers: are the products helpful? are their needs being met? Constructive criticism helps marketers adjust offerings to meet customer needs."
[commons.wikimedia.org/ wiki/ File:Business_ Feedback_ Loop_ PNG_ version.png]
The cycle process diagram example "Business feedback loop" was created using the ConceptDraw PRO diagramming and vector drawing software extended with the Sales Flowcharts solution from the Marketing area of ConceptDraw Solution Park.
Customers feedback cycle process chart

The vector stencils library "Business" contains 24 business icons.
Use it to design your business and finance illustrations and infographics with ConceptDraw PRO diagramming and vector drawing software.
The vector stencils library "Business" is included in the Business and Finance solution from the Illustration area of ConceptDraw Solution Park.
Use it to design your business and finance illustrations and infographics with ConceptDraw PRO diagramming and vector drawing software.
The vector stencils library "Business" is included in the Business and Finance solution from the Illustration area of ConceptDraw Solution Park.
Company

Office branch

Bank

Income

Exchange

Business statistics

Mechanism

Commerce

Handshake

Business contract

Reporting

Risk

Targeting

Key to success

Transcontinental corporation

Credit debt

Taxes

Bankruptcy

Money case

ATM
Cash register

Buying

Exhibition

Delivery

The vector stencils library "Business" contains 24 business icons.
Use it to design your business and finance illustrations and infographics with ConceptDraw PRO diagramming and vector drawing software.
The vector stencils library "Business" is included in the Business and Finance solution from the Illustration area of ConceptDraw Solution Park.
Use it to design your business and finance illustrations and infographics with ConceptDraw PRO diagramming and vector drawing software.
The vector stencils library "Business" is included in the Business and Finance solution from the Illustration area of ConceptDraw Solution Park.
Company
Office branch
Bank
Income
Exchange
Business statistics
Mechanism
Commerce
Handshake
Business contract
Reporting
Risk
Targeting
Key to success
Transcontinental corporation
Credit debt
Taxes
Bankruptcy
Money case
ATM
Cash register
Buying
Exhibition
Delivery
Export from ConceptDraw DIAGRAM Document to a Graphic File


Business - Design Elements

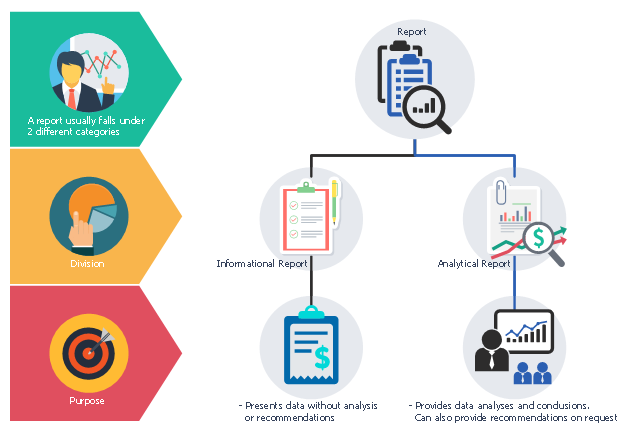
This business infographic sample shows the two types of report:
1. Informational report presents data without analysis or recommendations.
2. Analytical report provides data analyses and conclusions. Can also provide recommendations on request.
A report usually falls under 2 different categories: Division and Purpose.
This business infographic sample was designed on the base of the Wikimedia Commons file: Figure 12.1.png. [commons.wikimedia.org/ wiki/ File:Figure_ 12.1.png]
The business infographic example "Report" was designed using ConceptDraw PRO diagramming and vector drawing software extended with the Business and Finance solution from Illustration area of ConceptDraw Solution Park.
Infographic
 Business Process Workflow Diagrams
The Business Process Workflow Diagrams solution enhances the ConceptDraw DIAGRAM functionality with predesigned examples, samples and a numerous collection of predesigned vector objects of workflow chart elements, icons, arrows, connectors, and varied wor
The vector stencils library "Business people pictograms" contains 14 icons of business people.
Use it to draw your pictorial infographics.
The example "Business people pictograms - Vector stencils library" was created using the ConceptDraw PRO diagramming and vector drawing software extended with the Pictorial infographics solution from the area "What is infographics" in ConceptDraw Solution Park.
Businessman

Businesswoman

Businessman, full grown

Businesswoman, full grown

Business group

Work team

Presentation

Waiting

Working time

Discussion

Business idea

Agreement

Career

Business growth

Advertising - Design Elements

Business Structure

HelpDesk
How to Save a Drawing as a Graphic File

The vector stencils library "Business people pictograms" contains 14 icons of business people.
Use it to draw your pictorial infographics.
The example "Business people pictograms - Vector stencils library" was created using the ConceptDraw PRO diagramming and vector drawing software extended with the Pictorial infographics solution from the area "What is infographics" in ConceptDraw Solution Park.
Use it to draw your pictorial infographics.
The example "Business people pictograms - Vector stencils library" was created using the ConceptDraw PRO diagramming and vector drawing software extended with the Pictorial infographics solution from the area "What is infographics" in ConceptDraw Solution Park.
Businessman
Businesswoman
Businessman, full grown
Businesswoman, full grown
Business group
Work team
Presentation
Waiting
Working time
Discussion
Business idea
Agreement
Career
Business growth
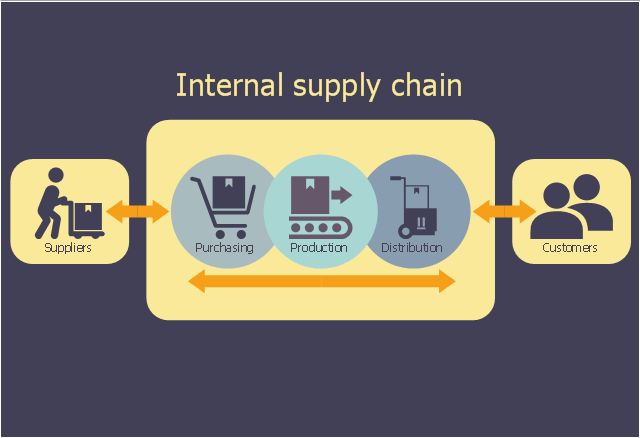
This logistic flow chart sample shows the company's supply chain. It was designed on the base of the Wikimedia Commons file: A company's supply chain (en).png. [commons.wikimedia.org/ wiki/ File:A_ company%27s_ supply_ chain_ (en).png]
This file is licensed under the Creative Commons Attribution-Share Alike 3.0 Unported license. [creativecommons.org/ licenses/ by-sa/ 3.0/ deed.en]
"A supply chain is a system of organizations, people, activities, information, and resources involved in moving a product or service from supplier to customer. Supply chain activities involve the transformation of natural resources, raw materials, and components into a finished product that is delivered to the end customer. In sophisticated supply chain systems, used products may re-enter the supply chain at any point where residual value is recyclable. Supply chains link value chains." [Supply chain. Wikipedia]
The logistic flowchart example "A company's supply chain" was created using ConceptDraw PRO diagramming and vector drawing software extended with the Logistics Flow Charts solution from the Business Processes area of ConceptDraw Solution Park.
Logistic flowchart
The vector stencils library "Business" contains 24 business icons.
Use it to design your business and finance illustrations and infographics with ConceptDraw PRO diagramming and vector drawing software.
The vector stencils library "Business" is included in the Business and Finance solution from the Illustration area of ConceptDraw Solution Park.
Use it to design your business and finance illustrations and infographics with ConceptDraw PRO diagramming and vector drawing software.
The vector stencils library "Business" is included in the Business and Finance solution from the Illustration area of ConceptDraw Solution Park.
Company
Office branch
Bank
Income
Exchange
Business statistics
Mechanism
Commerce
Handshake
Business contract
Reporting
Risk
Targeting
Key to success
Transcontinental corporation
Credit debt
Taxes
Bankruptcy
Money case
ATM
Cash register
Buying
Exhibition
Delivery
Business People Figures

The vector stencils library "Management pictograms" contains 72 management pictograms.
Use it to create your management infogram in the ConceptDraw PRO diagramming and vector drawing software.
The flat icons example "Management pictograms - Vector stencils library" is included in the solution "Marketing infographics" from the "Business infographics" area of ConceptDraw Solution Park.
Use it to create your management infogram in the ConceptDraw PRO diagramming and vector drawing software.
The flat icons example "Management pictograms - Vector stencils library" is included in the solution "Marketing infographics" from the "Business infographics" area of ConceptDraw Solution Park.
Accounting management

Activity

Audit management

Board of directors

Budget

Business managemen

Business management tools

Business model

Commanding

Communication

Company

Contract management

Controlling

Coordinating

Core competencies

Corporate strategy

Creativity

Crisis management

Crisis management 2

Decision making

Environmental management

Expenses

External environment

Financial management

Financial management 2

Financial planning

First-level manager

Goal

HR management

Investment management

IT management

Knowledge management

Knowledge management 2

Leadership

Macro environment

Management system

Managerial accounting

Manufacturing management

Market orientation

Marketing management

Marketing strategy

Middle-level manager

Mission

Objectives

Operations management

Organizing

Performance

Performance management

Planning

Policy

PR management

Problem solving

Process management

Product management

Profit

Profit 2

Project management

Quality management

Research and development

Resource management

Resources

Risk management

Sales manegment

Service management

Stakeholder management

Strategic management

Strategic planning

Technology management

Time frame

Time management

Top-level manager

Vision

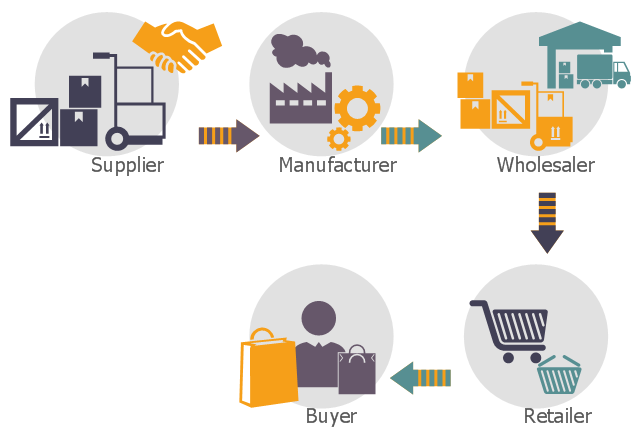
This logistic flow chart sample shows the groups in a supply chain cut out by disintermediation.
It was designed on the base of the Wikimedia Commons file: Disintermediation graphic.PNG. [commons.wikimedia.org/ wiki/ File:Disintermediation_ graphic.PNG]
This file is licensed under the Creative Commons Attribution-Share Alike 3.0 Unported license. [creativecommons.org/ licenses/ by-sa/ 3.0/ deed.en]
"In economics, disintermediation is the removal of intermediaries from a supply chain, or "cutting out the middlemen" in connection with a transaction or a series of transactions. Instead of going through traditional distribution channels, which had some type of intermediary (such as a distributor, wholesaler, broker, or agent), companies may now deal with customers directly, for example via the Internet." [Disintermediation. Wikipedia]
The logistic flowchart example "Groups in a supply chain cut out by disintermediation" was created using ConceptDraw PRO diagramming and vector drawing software extended with the Logistics Flow Charts solution from the Business Processes area of ConceptDraw Solution Park.
Logistic flowchart
Winter Sports Vector Clipart. Medal Map. Spatial Infographics

- Business Vector Png
- Png Hand Shake
- Business - Vector stencils library | Design elements - Currency ...
- Design Elements | Bank Branches Logo In Vector Png
- HR symbols - Vector stencils library | Business - Vector stencils ...
- Currency - Vector stencils library | Business - Vector stencils library ...
- Business people - Vector stencils library | Workflow Diagram ...
- IVR business - Vector stencils library | Bullhorn Vector Png
- Finance - Vector stencils library | Business People Clipart | Business ...
- IVR business - Vector stencils library | Bull Horn Png
- Business people pictograms - Vector stencils library | Draw ...
- Business people - Vector stencils library | Design elements - Scrum ...
- HR steps - Vector stencils library | Business people - Vector stencils ...
- Design elements - Business people | Business people - Vector ...
- Business People Vector Png
- Success Png Vectors
- Business people pictograms - Vector stencils library | Business ...
- Vector Tax Png
- Business people - Vector stencils library | Medicine and health ...
- Finance - Vector stencils library | Business People Clipart ...