The vector stencils library "Marketing pictograms" contains pictogram set of 34 flaticons.
Use these flat icons to design your marketing infograms.
"A pictogram, also called a pictogramme, pictograph, or simply picto, and also an 'icon', is an ideogram that conveys its meaning through its pictorial resemblance to a physical object. Pictographs are often used in writing and graphic systems in which the characters are to a considerable extent pictorial in appearance." [Pictogram. Wikipedia]
The shapes example "Design elements - Marketing pictograms" was created using the ConceptDraw PRO diagramming and vector drawing software extended with the Marketing Infographics solition from the area "Business Infographics" in ConceptDraw Solution Park.
Flat icons
Competitor Analysis

The vector stencils library "Marketing" contains 30 marketing icons.
Use it to design your business and finance illustrations and infographics with ConceptDraw PRO diagramming and vector drawing software.
The vector stencils library "Marketing" is included in the Business and Finance solution from the Illustration area of ConceptDraw Solution Park.
Use it to design your business and finance illustrations and infographics with ConceptDraw PRO diagramming and vector drawing software.
The vector stencils library "Marketing" is included in the Business and Finance solution from the Illustration area of ConceptDraw Solution Park.
Target

International sales

Shopping cart

Sign post

Pointing hand

First place

Market label

Umbrella

Balance scales

Rocket

Airplane

Truck

Train

Ship

Oil extraction

Oil barrel

Wooden barrel

Empty box

Full box

Building blocks

Stack of papers

Clipboard

Sunglasses

Thermometer

Question mark

Check mark

Cross mark

NO sign

Warning sign

Stop sign

Flowchart design. Flowchart symbols, shapes, stencils and icons


Pyramid Chart Examples

 Matrices
This solution extends ConceptDraw DIAGRAM software with samples, templates and library of design elements for drawing the business matrix diagrams.
Flowchart design. Flowchart symbols, shapes, stencils and icons
 Target and Circular Diagrams
This solution extends ConceptDraw DIAGRAM software with samples, templates and library of design elements for drawing the Target and Circular Diagrams.
 Pyramid Diagrams
Pyramid Diagrams solution extends ConceptDraw DIAGRAM software with templates, samples and library of vector stencils for drawing the marketing pyramid diagrams.
 AWS Architecture Diagrams
AWS Architecture Diagrams with powerful drawing tools and numerous predesigned Amazon icons and AWS simple icons is the best for creation the AWS Architecture Diagrams, describing the use of Amazon Web Services or Amazon Cloud Services, their application for development and implementation the systems running on the AWS infrastructure. The multifarious samples give you the good understanding of AWS platform, its structure, services, resources and features, wide opportunities, advantages and benefits from their use; solution’s templates are essential and helpful when designing, description and implementing the AWS infrastructure-based systems. Use them in technical documentation, advertising and marketing materials, in specifications, presentation slides, whitepapers, datasheets, posters, etc.
How to Create a Pyramid Diagram

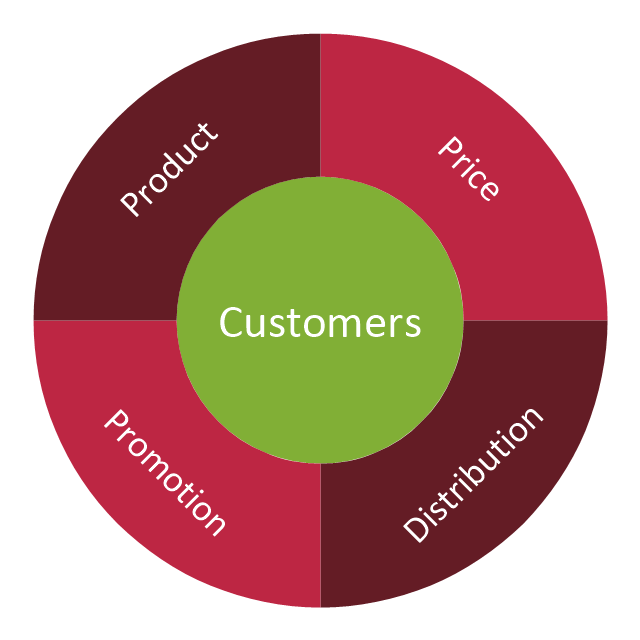
"The marketing mix is a business tool used in marketing and by marketing professionals. The marketing mix is often crucial when determining a product or brand's offer, and is often synonymous with the four Ps: price, product, promotion, and place ..." [Marketing mix. Wikipedia]
The example of wheel diagram (ring diagram, bevel style circle diagram, circular diagram) "Marketing mix" was created using the ConceptDraw PRO diagramming and vector drawing software extended with the Target and Circular Diagrams solution from the Marketing area of ConceptDraw Solution Park.
www.conceptdraw.com/ solution-park/ marketing-target-and-circular-diagrams
Marketing mix - Wheel diagram
How to Create a Bar Chart

How to Use the ″Online Store PR Campaign″ Sample

Example of DFD for Online Store (Data Flow Diagram)


- Marketing Branding Examples
- Microsoft Brand Products
- Marketing Brand Diagram
- Content Marketing Infographics | Design elements - Content Views ...
- Pyramid Chart Examples | Competitor Analysis | Marketing ...
- Brands Available In Market Diagrams
- Block diagram - Branding strategies | Pyramid Chart Examples ...
- Competitor Analysis | Positioning map | SWOT Analysis | Brand ...
- Competitor Analysis | Fishbone Diagrams | PM Dashboards | Brand ...
- Infographic Icon Png
- AWS Simple Icons for Architecture Diagrams | Flowchart design ...
- Brand essence model - Wheel diagram | Competitor Analysis ...
- Strategic Brand Wheel Brand Essence
- Design elements - People | Design elements - Marketing pictograms ...
- Brand essence model - Wheel diagram | Competitor Analysis ...
- Advertising Agency Icon
- Brand essence model - Wheel diagram | Top brand model - Pyramid ...
- Pyramid Chart Examples | Competitor Analysis | Brand essence ...
- Brand essence model - Wheel diagram | Competitor Analysis ...
- Block diagram - Branding strategies | Bar Diagrams for Problem ...