"Brand essence is a phrase that communicates the fundamental nature of a trade name associated with one or more products made by the same company. A business marketing team will often spend considerable time developing effective ways of expressing the brand essence of their company's various brands by highlighting the unique benefits provided that pertain to the values of its target subculture." [businessdictionary.com/ definition/ brand-essence.html]
Brand essence model diagram visually display key points of brand essence in easy to understand form.
The example of wheel diagram (ring diagram, bevel style circle diagram) "Brand essence model" was created using the ConceptDraw PRO diagramming and vector drawing software extended with the Target and Circular Diagrams solution from the Marketing area of ConceptDraw Solution Park.
www.conceptdraw.com/ solution-park/ marketing-target-and-circular-diagrams
Wheel diagram

 Target and Circular Diagrams
This solution extends ConceptDraw DIAGRAM software with samples, templates and library of design elements for drawing the Target and Circular Diagrams.
Competitor Analysis

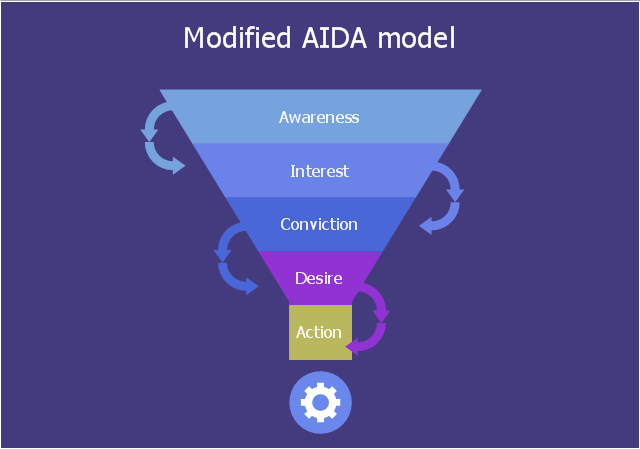
This funnel diagram sample shows 5 stages of modified AIDA model: Awareness, Interest, Conviction, Desire, Action. [Barry, T.E. and Howard, D.J., "A Review and Critique of the Hierarchy of Effects in Advertising," International Journal of Advertising, vol 9, no.2, 1990, pp. 121–135]
"AIDA is an acronym that stands for Attention, Interest, Desire and Action. The AIDA model is widely used in marketing and advertising to describe the steps or stages that occur from the time when a consumer first becomes aware of a product or brand through to when the consumer trials a product or makes a purchase decision. Given that many consumers become aware of brands via advertising or marketing communications, the AIDA model helps to explain how an advertisement or marketing communications message engages and involves consumers in brand choice. In essence, the AIDA model proposes that advertising messages need to accomplish a number of tasks in order to move the consumer through a series of sequential steps from brand awareness through to action (purchase and consumption)." [AIDA (marketing). Wikipedia]
The funnel diagram example "Modified AIDA model" was designed using ConceptDraw PRO software extended with Funnel Diagrams solution from Marketing area of ConceptDraw Solution Park.
Funnel diagram
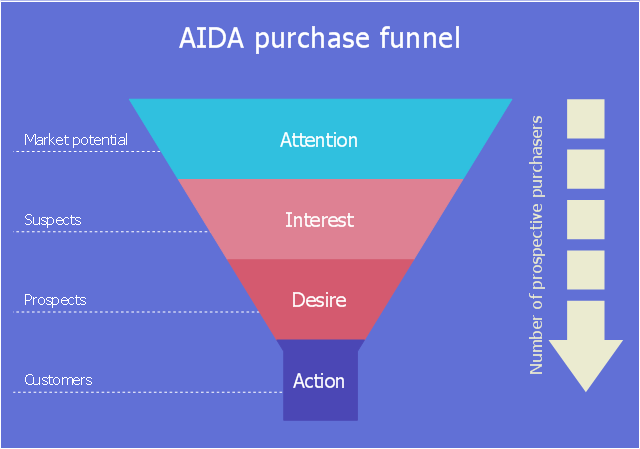
This funnel diagram sample shows 4 steps of AIDA marketing model: Attention, Interest, Desire and Action.
It was created on the base of Wikimedia Commons file: The Purchase Funnel.jpg [commons.wikimedia.org/ wiki/ File:The_ Purchase_ Funnel.jpg]
This file is licensed under the Creative Commons Attribution-Share Alike 4.0 International license. [creativecommons.org/ licenses/ by-sa/ 4.0/ deed.en]
"AIDA is an acronym that stands for Attention, Interest, Desire and Action. The AIDA model is widely used in marketing and advertising to describe the steps or stages that occur from the time when a consumer first becomes aware of a product or brand through to when the consumer trials a product or makes a purchase decision. Given that many consumers become aware of brands via advertising or marketing communications, the AIDA model helps to explain how an advertisement or marketing communications message engages and involves consumers in brand choice. In essence, the AIDA model proposes that advertising messages need to accomplish a number of tasks in order to move the consumer through a series of sequential steps from brand awareness through to action (purchase and consumption)." [AIDA (marketing). Wikipedia]
The funnel diagram example "AIDA purchase funnel" was designed using ConceptDraw PRO software extended with Funnel Diagrams solution from Marketing area of ConceptDraw Solution Park.
Marketing diagram
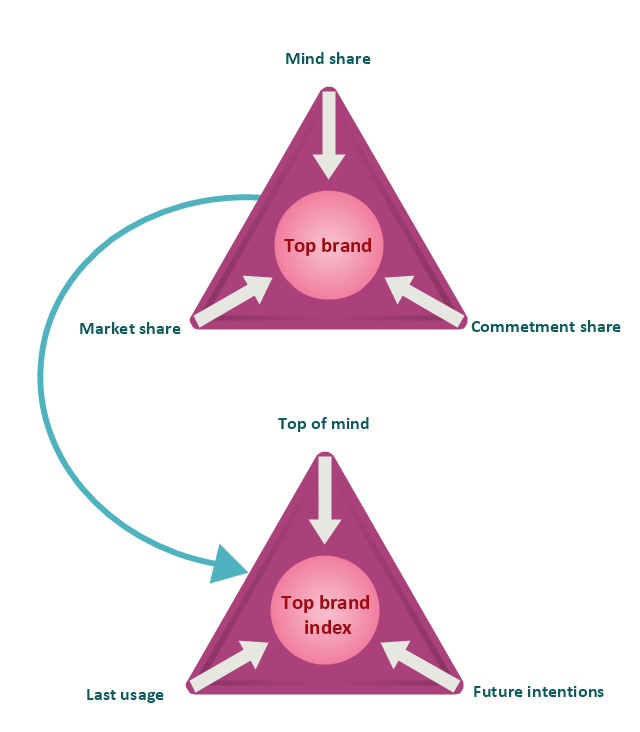
"Brand awareness refers to customers' ability to recall and recognize the brand under different conditions and link to the brand name, logo, jingles and so on to certain associations in memory. It consists of both brand recognition and brand recall. It helps the customers to understand to which product or service category the particular brand belongs and what products and services are sold under the brand name. It also ensures that customers know which of their needs are satisfied by the brand through its products (Keller). Brand awareness is of critical importance since customers will not consider your brand if they are not aware of it. There are various levels of brand awareness that require different levels and combinations of brand recognition and recall. Top-of-Mind is the goal of most companies. Top-of-mind awareness occurs when your brand is what pops into a consumers mind when asked to name brands in a product category." [Brand. Brand awareness. Wikipedia]
This top brand model pyramid diagram was redesigned using the ConceptDraw PRO diagramming and vector drawing software from Wikimedia Commons file Diagram Top Brand Model.jpg. [commons.wikimedia.org/ wiki/ File:Diagram_ Top_ Brand_ Model.jpg]
This file is licensed under the Creative Commons Attribution-Share Alike 3.0 Unported license. [creativecommons.org/ licenses/ by-sa/ 3.0/ deed.en]
The example "Top brand model pyramid diagram" is included in the Pyramid Diagrams solution from the Marketing area of ConceptDraw Solution Park.
Triangular charts
Pyramid Chart Examples

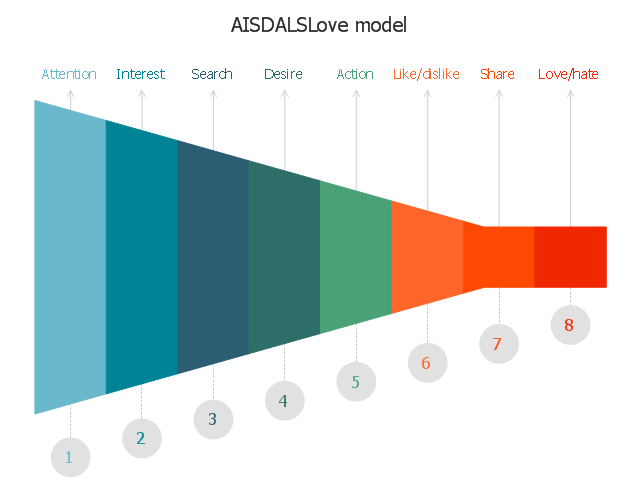
This funnel diagram sample shows 8 steps of AISDALSLove hierarchy of effects model: Attention, Interest, Search, Desire, Action, Like/ dislike, Share, and Love/ hate.
"AISDALSLove stands for Attention, Interest, Search, Desire, Action, Like/ dislike, Share, and Love/ hate, is a hierarchy of effects model in advertising...
The hierarchy of effects model AISDALSLove can be described as ‘A’ for Attention (the stage where the consumer audience firstly pay attention to the ad), ‘I’ for Interest (stage at which the consumer audience then become interested in that ad), ‘S’ for Search (the stage where the consumer audience will seek for information about the message or the advertised brand, both internally and externally). ’D’ for Desire (the stage where the consumer audience have a passion towards the brand or product after getting information about the brand or additional information regarding the advertising message), ’A’ for Action (stage at which the consumer audience take action in form of purchase of products or the election of a brand to satisfy his/ her desire), ’L’ for Like/ dislike (the stage where after experiencing a product or brand, the consumer audience will like or dislike towards that product). ’S’ for Share (this stage is a continuation from the previous stage, in which the consumer audience will express feelings of likes or dislikes by sharing their experience to other consumers directly or through media), and the last is ’Love’ for Love/ hate (the stage when after feeling satisfied or not satisfied, the consumer audience share their experiences with others, and generate long-term feelings towards the product or brand, these feelings can be either love or hate)." [AISDALSLove. Wikipedia]
The funnel diagram example "AISDALSLove hierarchy of effects model" was designed using ConceptDraw PRO software extended with Funnel Diagrams solution from Marketing area of ConceptDraw Solution Park.
Funnel diagram
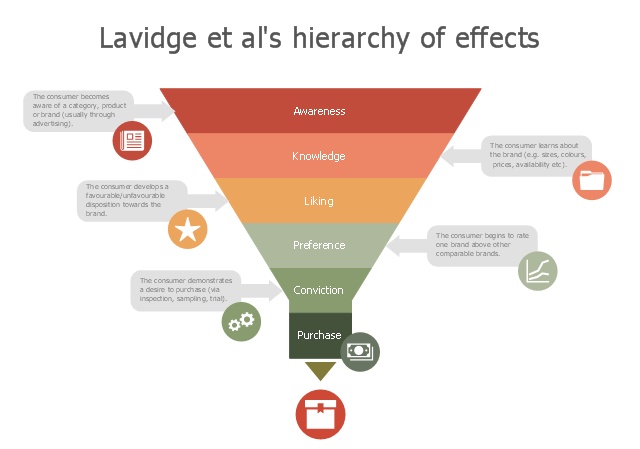
This funnel diagram sample shows 6 stages of Lavidge et al's hierarchy of effects: Awareness, Knowledge, Liking, Preference, Conviction, Purchase.
"The hierarchy of effects developed by Lavidge in the 1960s is one of the original hierarchical models. It proposes that customers progress through a sequence of six stages from brand awareness through to the purchase of a product.
Stage 1: Awareness - The consumer becomes aware of a category, product or brand (usually through advertising).
Stage 2: Knowledge - The consumer learns about the brand (e.g. sizes, colours, prices, availability etc).
Stage 3: Liking - The consumer develops a favourable/ unfavourable disposition towards the brand.
Stage 4: Preference - The consumer begins to rate one brand above other comparable brands.
Stage 5: Conviction - The consumer demonstrates a desire to purchase (via inspection, sampling, trial).
Stage 6: Purchase - The consumer acquires the product.
Hierarchical models have been widely adapted and many variations can be found, however, all follow the basic sequence which includes Cognition (C)- Affect (A) - Behaviour (B) and for this reason, they are sometimes known as C-A-B models." [Brand awareness. Wikipedia]
The funnel diagram example "Lavidge et al's hierarchy of effects" was designed using ConceptDraw PRO software extended with Funnel Diagrams solution from Marketing area of ConceptDraw Solution Park.
Funnel diagram
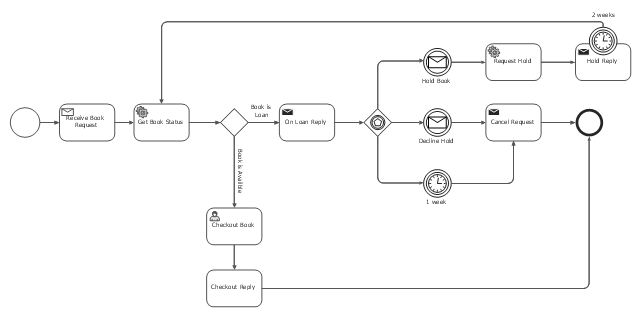
This BPMN (Business Process Model and Notation) diagram sample depicts the booking process workflow.
"The vision of BPMN 2.0 is to have one single specification for a new Business Process Model and Notation that defines the notation, metamodel and interchange format but with a modified name that still preserves the "BPMN" brand. The features include:
(1) Aligning BPMN with the business process definition meta model BPDM to form a single consistent language.
(2) Enabling the exchange of business process models and their diagram layouts among process modeling tools to preserve semantic integrity.
(3) Expand BPMN to allow model orchestrations and choreographies as stand-alone or integrated models.
(4) Support the display and interchange of different perspectives on a model that allow a user to focus on specific concerns.
(5) Serialize BPMN and provide XML schemes for model transformation and to extend BPMN towards business modeling and executive decision support." [Business Process Model and Notation. Wikipedia]
The business process modeling diagram example "Booking process - BPMN 2.0 diagram" was designed using the ConceptDraw PRO diagramming and vector drawing software extended with the Business Process Model and Notation solution from the Business Processes area of ConceptDraw Solution Park.
Business process modeling
 Pyramid Diagrams
Pyramid Diagrams solution extends ConceptDraw DIAGRAM software with templates, samples and library of vector stencils for drawing the marketing pyramid diagrams.
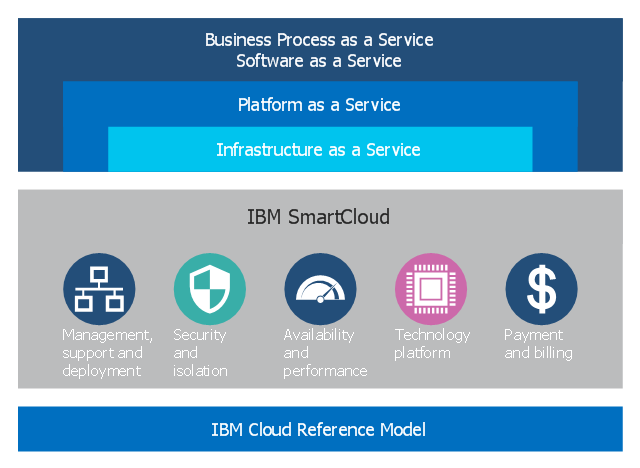
This cloud computing diagram example was drawn on the base of Wikimedia Commons file: SmartCloud diagram.jpg. [commons.wikimedia.org/ wiki/ File:SmartCloud_ diagram.jpg]
"The IBM SmartCloud brand includes infrastructure as a service, software as a service and platform as a service offered through public, private and hybrid cloud delivery models. IBM places these offerings under three umbrellas: SmartCloud Foundation, SmartCloud Services and SmartCloud Solutions." [IBM cloud computing. Wikipedia]
The cloud computing infographic example "IBM SmartCloud diagram" was drawn using ConceptDraw PRO software extended with the Cloud Computing Diagrams solution from the Computer and Networks area of ConceptDraw Solution Park.
Cloud computing infographic
How To Create Onion Diagram

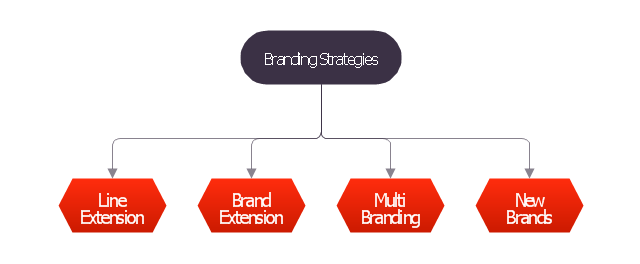
"Branding strategies.
Company name.
Often, especially in the industrial sector, it is just the company's name which is promoted...
Individual branding.
Each brand has a separate name ..., which may compete against other brands from the same company...
Attitude branding and iconic brands.
Attitude branding is the choice to represent a larger feeling, which is not necessarily connected with the product or consumption of the product at all. ...
Iconic brands are defined as having aspects that contribute to consumer's self-expression and personal identity. ...
"No-brand" branding.
Recently a number of companies have successfully pursued "no-brand" strategies by creating packaging that imitates generic brand simplicity.
Derived brands.
In this case the supplier of a key component, used by a number of suppliers of the end-product, may wish to guarantee its own position by promoting that component as a brand in its own right.
Brand extension and brand dilution.
The existing strong brand name can be used as a vehicle for new or modified products ...
Social media brands.
social media brands may be the most evolved version of the brand form, because they focus not on themselves but on their users. ...
Multi-brands.
Alternatively, in a market that is fragmented amongst a number of brands a supplier can choose deliberately to launch totally new brands in apparent competition with its own existing strong brand ...
Private labels.
Private label brands, also called own brands, or store brands have become popular. Where the retailer has a particularly strong identity this "own brand" may be able to compete against even the strongest brand leaders ...
Individual and organizational brands.
There are kinds of branding that treat individuals and organizations as the products to be branded. Personal branding treats persons and their careers as brands. ... Faith branding treats religious figures and organizations as brands. ... Nation branding works with the perception and reputation of countries as brands. ...
Crowd sourcing branding.
These are brands that are created by "the public" for the business, which is opposite to the traditional method where the business create a brand. ...
Nation branding (place branding and public diplomacy).
Nation branding is a field of theory and practice which aims to measure, build and manage the reputation of countries ...
Destination Branding.
Destination Branding is the work of cities, states, and other localities to promote to themselves." [Brand. Wikipedia]
The block diagram example "Branding strategies" was created using the ConceptDraw PRO diagramming and vector drawing software extended with the Block Diagrams solution from the area "What is a Diagram" of ConceptDraw Solution Park.
Block diagram
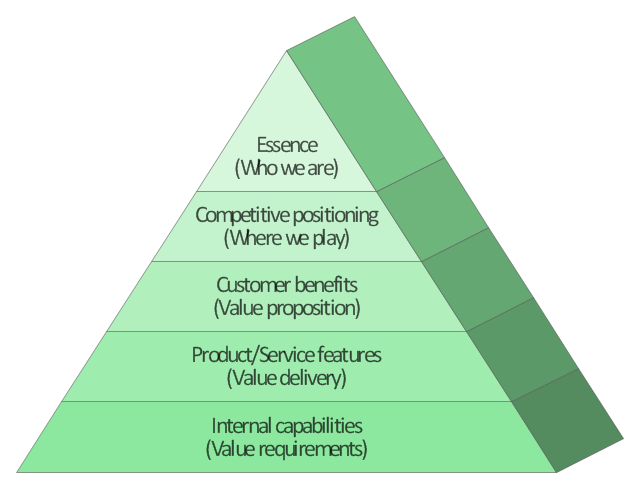
This market value pyramid diagram has 5 levels:
1) Essence (Who we are),
2) Competitive positioning (Where we play),
3) Customer benefits (Value proposition),
4) Product / Service features (Value delivery),
5) Internal capabilitiea (Value requirements).
Use this triangular scheme to develop your marketing strategy.
"Market value or OMV (Open Market Valuation) is the price at which an asset would trade in a competitive auction setting. Market value is often used interchangeably with open market value, fair value or fair market value, although these terms have distinct definitions in different standards, and may differ in some circumstances." [Market value. Wikipedia]
The triangle chart example "Market value" was created using the ConceptDraw PRO diagramming and vector drawing software extended with the Pyramid Diagrams solution from the Marketing area of ConceptDraw Solution Park.
Pyramid diagram
 Marketing Diagrams
Marketing Diagrams solution extends ConceptDraw DIAGRAM diagramming software with abundance of samples, templates and vector design elements intended for easy graphical visualization and drawing different types of Marketing diagrams and graphs, including Branding Strategies Diagram, Five Forces Model Diagram, Decision Tree Diagram, Puzzle Diagram, Step Diagram, Process Chart, Strategy Map, Funnel Diagram, Value Chain Diagram, Ladder of Customer Loyalty Diagram, Leaky Bucket Diagram, Promotional Mix Diagram, Service-Goods Continuum Diagram, Six Markets Model Diagram, Sources of Customer Satisfaction Diagram, etc. Analyze effectively the marketing activity of your company and apply the optimal marketing methods with ConceptDraw DIAGRAM software.
Gane Sarson Diagram

Stakeholder Onion Diagram Template

This arrow circle diagram sample was redesigned from the Wikimedia Commons file: Loyalitätskreislauf-klein.jpg. [commons.wikimedia.org/ wiki/ File:Loyalit%C3%A4tskreislauf-klein.jpg]
This file is licensed under the Creative Commons Attribution-Share Alike 3.0 Unported license. [creativecommons.org/ licenses/ by-sa/ 3.0/ deed.en]
"Loyalty marketing is an approach to marketing, based on strategic management, in which a company focuses on growing and retaining existing customers through incentives. Branding, product marketing and loyalty marketing all form part of the customer proposition - the subjective assessment by the customer of whether to purchase a brand or not based on the integrated combination of the value they receive from each of these marketing disciplines.
The discipline of customer loyalty marketing has been around for many years...
In recent years, a new marketing discipline called "customer advocacy marketing" has been combined with or replaced "customer loyalty marketing." " [Loyalty marketing. Wikipedia]
The arrow circle diagram example "Loyalty" was created using the ConceptDraw PRO diagramming and vector drawing software extended with the Target and Circular Diagrams solution from the Marketing area of ConceptDraw Solution Park.
www.conceptdraw.com/ solution-park/ marketing-target-and-circular-diagrams
Arrow circle diagram
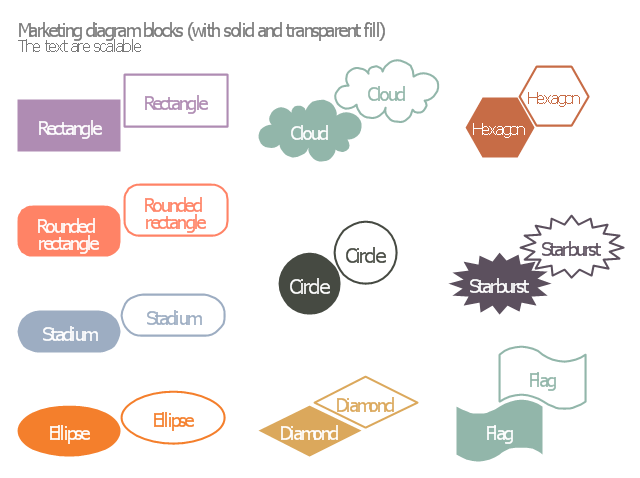
The vector stencils library "Marketing diagram" contains 20 solid and transparent geometric shapes: rectangle, rounded rectangle, ellipse, cloud, circle, diamond, hexagon, starburst, flag.
Use it to illustrate your marketing infograms with block diagrams.
"The term diagram in its commonly used sense can have a general or specific meaning:
(1) visual information device: Like the term "illustration" the diagram is used as a collective term standing for the whole class of technical genres, including graphs, technical drawings and tables.
(2) specific kind of visual display: This is the genre that shows qualitative data with shapes that are connected by lines, arrows, or other visual links. ...
In the specific sense diagrams and charts contrast with computer graphics, technical illustrations, infographics, maps, and technical drawings, by showing "abstract rather than literal representations of information". The essence of a diagram can be seen as:
(1) a form of visual formatting devices;
(2) a display that does not show quantitative data (numerical data), but rather relationships and abstract information;
(3) with building blocks such as geometrical shapes connected by lines, arrows, or other visual links." [Diagram. Wikipedia]
The shapes example "Design elements - Marketing diagram" was created using the ConceptDraw PRO diagramming and vector drawing software extended with the Marketing Infographics solition from the area "Business Infographics" in ConceptDraw Solution Park.
Diagram building blocks
- Brand essence model - Wheel diagram | Competitor Analysis ...
- Brand essence model - Wheel diagram | Brand essence model ...
- Brand essence model - Wheel diagram
- Brand essence model - Wheel diagram | Circle Spoke Diagram ...
- Brand essence model - Wheel diagram | Target and Circular ...
- Competitor Analysis | Positioning map | Brand essence model ...
- Block diagram - Branding strategies | Brand essence model - Wheel ...
- Brand essence model - Wheel diagram | Forces shaping the ...
- Pyramid Chart Examples | Brand essence model - Wheel diagram ...
- Circular diagrams - Vector stencils library | Brand essence model ...
- Concept Maps | Basic Flowchart Symbols and Meaning | Circle ...
- Block diagram - Branding strategies | Competitor Analysis ...
- Target market - Onion diagram | Target and Circular Diagrams ...
- Competitor Analysis | Marketing | Design elements - Sales KPIs and ...
- Releashinship Between Brand Wheel And Brand Pyramid
- Strategic Brand Wheel
- Relationship Between Brand Strategies Which Is Brand Pyramid
- Top brand model - Pyramid diagram | Pyramid Diagrams | Brand ...
- Matrices | Marketing Area | Bcg And Brand Pyramid