"Brand essence is a phrase that communicates the fundamental nature of a trade name associated with one or more products made by the same company. A business marketing team will often spend considerable time developing effective ways of expressing the brand essence of their company's various brands by highlighting the unique benefits provided that pertain to the values of its target subculture." [businessdictionary.com/ definition/ brand-essence.html]
Brand essence model diagram visually display key points of brand essence in easy to understand form.
The example of wheel diagram (ring diagram, bevel style circle diagram) "Brand essence model" was created using the ConceptDraw PRO diagramming and vector drawing software extended with the Target and Circular Diagrams solution from the Marketing area of ConceptDraw Solution Park.
www.conceptdraw.com/ solution-park/ marketing-target-and-circular-diagrams
Wheel diagram

 Target and Circular Diagrams
This solution extends ConceptDraw DIAGRAM software with samples, templates and library of design elements for drawing the Target and Circular Diagrams.
Competitor Analysis

Pyramid Chart Examples

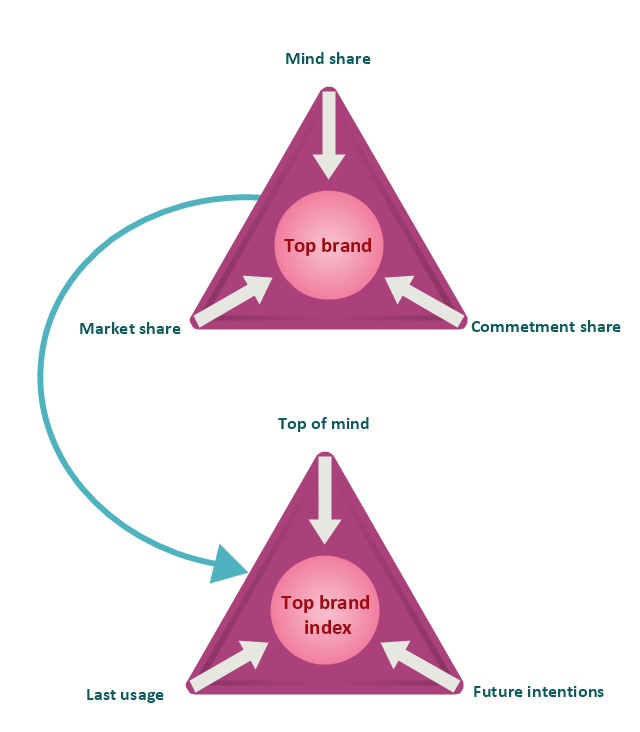
"Brand awareness refers to customers' ability to recall and recognize the brand under different conditions and link to the brand name, logo, jingles and so on to certain associations in memory. It consists of both brand recognition and brand recall. It helps the customers to understand to which product or service category the particular brand belongs and what products and services are sold under the brand name. It also ensures that customers know which of their needs are satisfied by the brand through its products (Keller). Brand awareness is of critical importance since customers will not consider your brand if they are not aware of it. There are various levels of brand awareness that require different levels and combinations of brand recognition and recall. Top-of-Mind is the goal of most companies. Top-of-mind awareness occurs when your brand is what pops into a consumers mind when asked to name brands in a product category." [Brand. Brand awareness. Wikipedia]
This top brand model pyramid diagram was redesigned using the ConceptDraw PRO diagramming and vector drawing software from Wikimedia Commons file Diagram Top Brand Model.jpg. [commons.wikimedia.org/ wiki/ File:Diagram_ Top_ Brand_ Model.jpg]
This file is licensed under the Creative Commons Attribution-Share Alike 3.0 Unported license. [creativecommons.org/ licenses/ by-sa/ 3.0/ deed.en]
The example "Top brand model pyramid diagram" is included in the Pyramid Diagrams solution from the Marketing area of ConceptDraw Solution Park.
Triangular charts
Pie Chart Examples and Templates

Pyramid Charts

Gane Sarson Diagram

Material Requisition Flowchart. Flowchart Examples

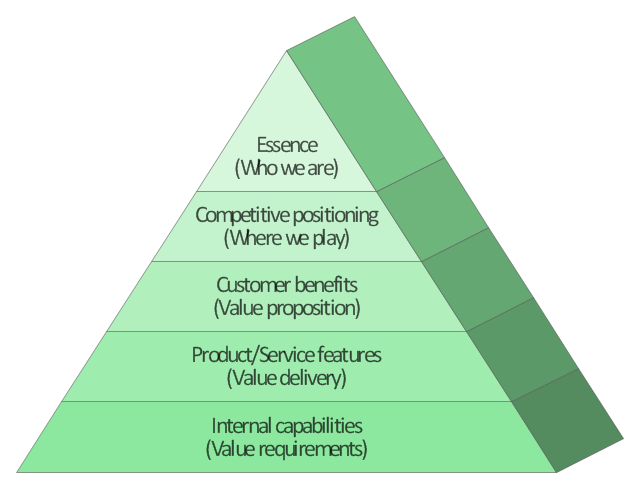
This market value pyramid diagram has 5 levels:
1) Essence (Who we are),
2) Competitive positioning (Where we play),
3) Customer benefits (Value proposition),
4) Product / Service features (Value delivery),
5) Internal capabilitiea (Value requirements).
Use this triangular scheme to develop your marketing strategy.
"Market value or OMV (Open Market Valuation) is the price at which an asset would trade in a competitive auction setting. Market value is often used interchangeably with open market value, fair value or fair market value, although these terms have distinct definitions in different standards, and may differ in some circumstances." [Market value. Wikipedia]
The triangle chart example "Market value" was created using the ConceptDraw PRO diagramming and vector drawing software extended with the Pyramid Diagrams solution from the Marketing area of ConceptDraw Solution Park.
Pyramid diagram
Food Art

How To Create Onion Diagram

 Marketing Diagrams
Marketing Diagrams solution extends ConceptDraw DIAGRAM diagramming software with abundance of samples, templates and vector design elements intended for easy graphical visualization and drawing different types of Marketing diagrams and graphs, including Branding Strategies Diagram, Five Forces Model Diagram, Decision Tree Diagram, Puzzle Diagram, Step Diagram, Process Chart, Strategy Map, Funnel Diagram, Value Chain Diagram, Ladder of Customer Loyalty Diagram, Leaky Bucket Diagram, Promotional Mix Diagram, Service-Goods Continuum Diagram, Six Markets Model Diagram, Sources of Customer Satisfaction Diagram, etc. Analyze effectively the marketing activity of your company and apply the optimal marketing methods with ConceptDraw DIAGRAM software.
 Pyramid Diagrams
Pyramid Diagrams solution extends ConceptDraw DIAGRAM software with templates, samples and library of vector stencils for drawing the marketing pyramid diagrams.
 MindTweet
This solution extends ConceptDraw MINDMAP software with the ability to brainstorm, review and organize the sending of Tweets.
Stakeholder Onion Diagram Template

This wheel diagram sample was created on the base of figure illustrating the webpage "Chapter 3: Current State of the Ecosystem" of the website of the National Broadband Plan of US Federal Communications Comission (FCC). "The broadband ecosystem includes applications and content: e-mail, search, news, maps, sales and marketing applications used by businesses, user-generated video and hundreds of thousands of more specialized uses. Ultimately, the value of broadband is realized when it delivers useful applications and content to end-users.
Applications run on devices that attach to the network and allow users to communicate: computers, smartphones, set-top boxes, e-book readers, sensors, private branch exchanges (PBX), local area network routers, modems and an ever-growing list of other devices. New devices mean new opportunities for applications and content.
Finally, broadband networks can take multiple forms: wired or wireless, fixed or mobile, terrestrial or satellite. Different types of networks have different capabilities, benefits and costs.
The value of being connected to the network increases as more people and businesses choose to adopt broadband and use applications and devices that the network supports. Several factors contribute to their decisions. These include whether they can afford a connection, whether they are comfortable with digital technology and whether they believe broadband is useful.
Networks, devices and applications drive each other in a virtuous cycle. If networks are fast, reliable and widely available, companies produce more powerful, more capable devices to connect to those networks. These devices, in turn, encourage innovators and entrepreneurs to develop exciting applications and content. These new applications draw interest among end-users, bring new users online and increase use among those who already subscribe to broadband services. This growth in the broadband ecosystem reinforces the cycle, encouraging service providers to boost the speed, functionality and reach of their networks."
[broadband.gov/ plan/ 3-current-state-of-the-ecosystem/ ]
The circle pie chart example "Forces shaping the broadband ecosystem in the US" was created using the ConceptDraw PRO diagramming and vector drawing software extended with the Target and Circular Diagrams solution from the Marketing area of ConceptDraw Solution Park.
www.conceptdraw.com/ solution-park/ marketing-target-and-circular-diagrams
Wheel diagram

This circle pie chart sample was created on the base of the figure illustrating the article "Impacts of Parking Strategies" from the Chicago Metropolitan Agency for Planning website. "Todd Litman's "Cycle of Automobile Dependency" shows how auto-centric land use planning and excessive parking supply have created this situation. Parking management strategies can be used to break this cycle, by changing development patterns and improving travel options (2006)." [cmap.illinois.gov/ about/ 2040/ supporting-materials/ process-archive/ strategy-papers/ parking/ impacts-of-parking-strategies]
The circle pie chart example "Cycle of automobile dependency" was created using the ConceptDraw PRO diagramming and vector drawing software extended with the Target and Circular Diagrams solution from the Marketing area of ConceptDraw Solution Park.
www.conceptdraw.com/ solution-park/ marketing-target-and-circular-diagrams
Circle pie chart

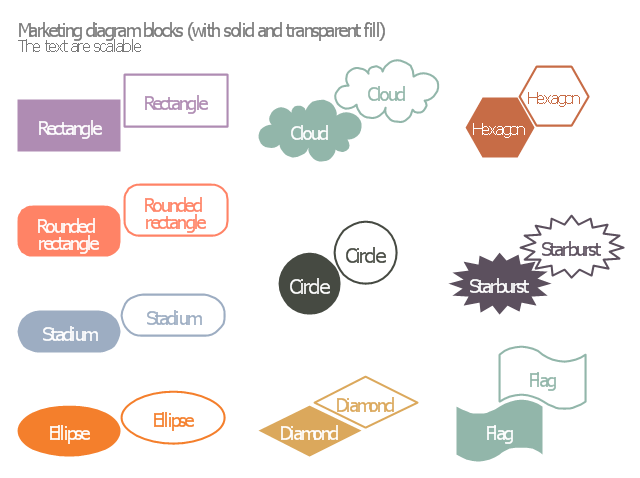
The vector stencils library "Marketing diagram" contains 20 solid and transparent geometric shapes: rectangle, rounded rectangle, ellipse, cloud, circle, diamond, hexagon, starburst, flag.
Use it to illustrate your marketing infograms with block diagrams.
"The term diagram in its commonly used sense can have a general or specific meaning:
(1) visual information device: Like the term "illustration" the diagram is used as a collective term standing for the whole class of technical genres, including graphs, technical drawings and tables.
(2) specific kind of visual display: This is the genre that shows qualitative data with shapes that are connected by lines, arrows, or other visual links. ...
In the specific sense diagrams and charts contrast with computer graphics, technical illustrations, infographics, maps, and technical drawings, by showing "abstract rather than literal representations of information". The essence of a diagram can be seen as:
(1) a form of visual formatting devices;
(2) a display that does not show quantitative data (numerical data), but rather relationships and abstract information;
(3) with building blocks such as geometrical shapes connected by lines, arrows, or other visual links." [Diagram. Wikipedia]
The shapes example "Design elements - Marketing diagram" was created using the ConceptDraw PRO diagramming and vector drawing software extended with the Marketing Infographics solition from the area "Business Infographics" in ConceptDraw Solution Park.
Diagram building blocks
- Competitor Analysis | Positioning map | Brand essence model ...
- Brand essence model - Wheel diagram | Competitor Analysis ...
- Brand essence model - Wheel diagram | Circle Spoke Diagram ...
- Pyramid Chart Examples | Brand essence model - Wheel diagram ...
- Brand essence model - Wheel diagram | Forces shaping the ...
- Brand essence model - Wheel diagram | Target and Circular ...
- Block diagram - Branding strategies | Brand essence model - Wheel ...
- Brand essence model - Wheel diagram
- Circular diagrams - Vector stencils library | Brand essence model ...
- Brand essence model - Wheel diagram
- Concept Maps | Basic Flowchart Symbols and Meaning | Circle ...
- Pie Chart Marketing Mix Products
- Social Brand Strategy | Pyramid Chart Examples | Competitor ...
- Releashinship Between Brand Wheel And Brand Pyramid
- Brand Onion Template
- Relationship Between Brand Strategies Which Is Brand Pyramid
- Social Brand Strategy | Pyramid Chart Examples | Block diagram ...
- Strategic Brand Wheel
- Top brand model - Pyramid diagram | Pyramid Diagrams | Brand ...