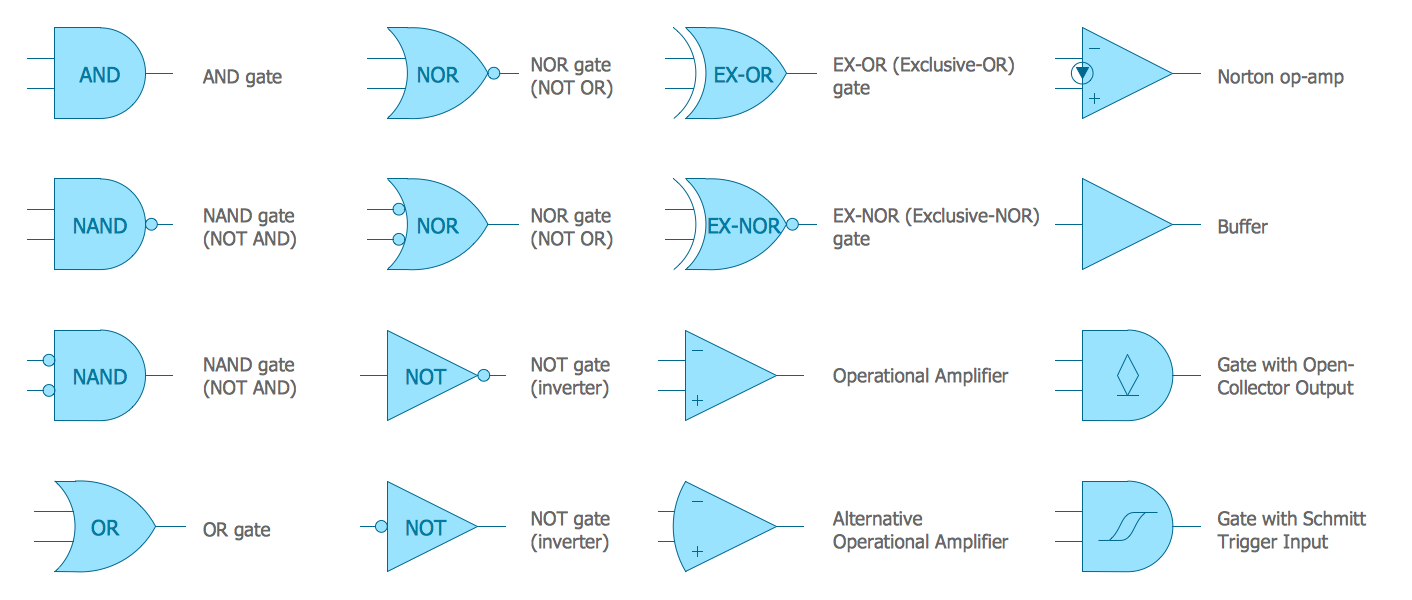
Electrical Symbols — Logic Gate Diagram
Circuits and Logic Diagram Software

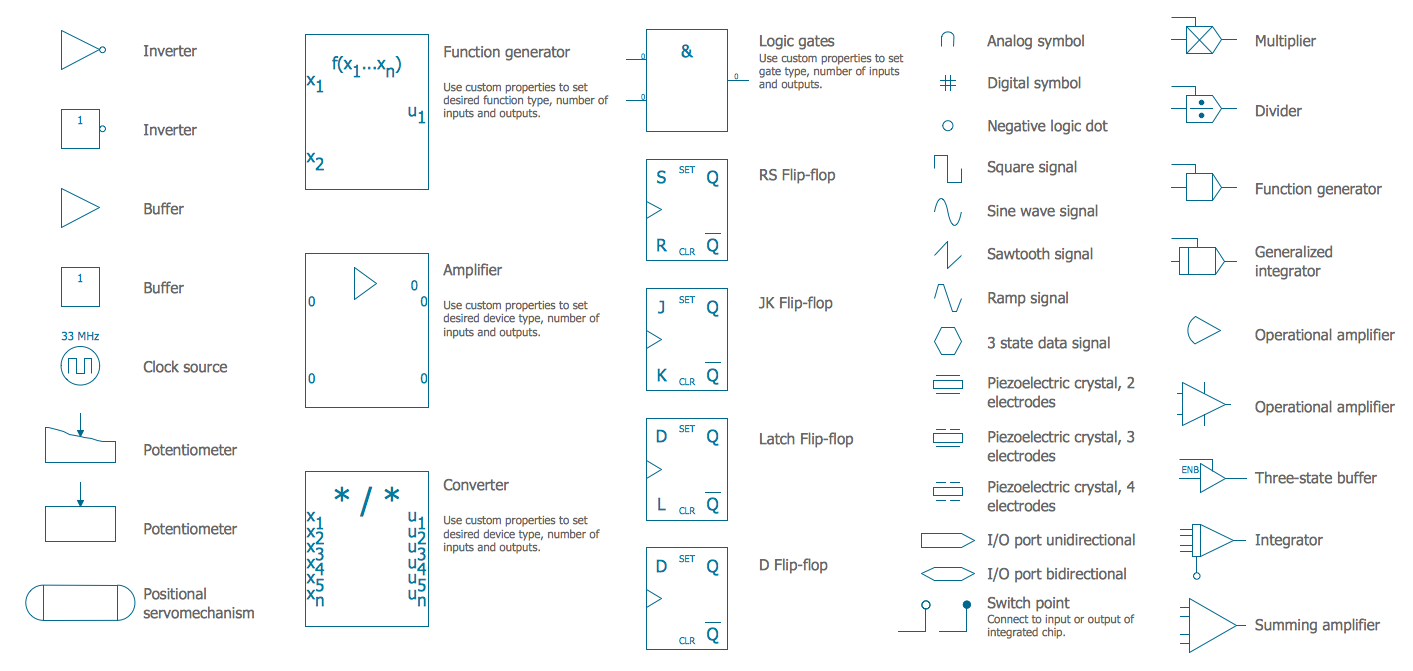
Electrical Symbols — Analog and Digital Logic
Electrical Symbols, Electrical Schematic Symbols
Cisco Buildings. Cisco icons, shapes, stencils and symbols
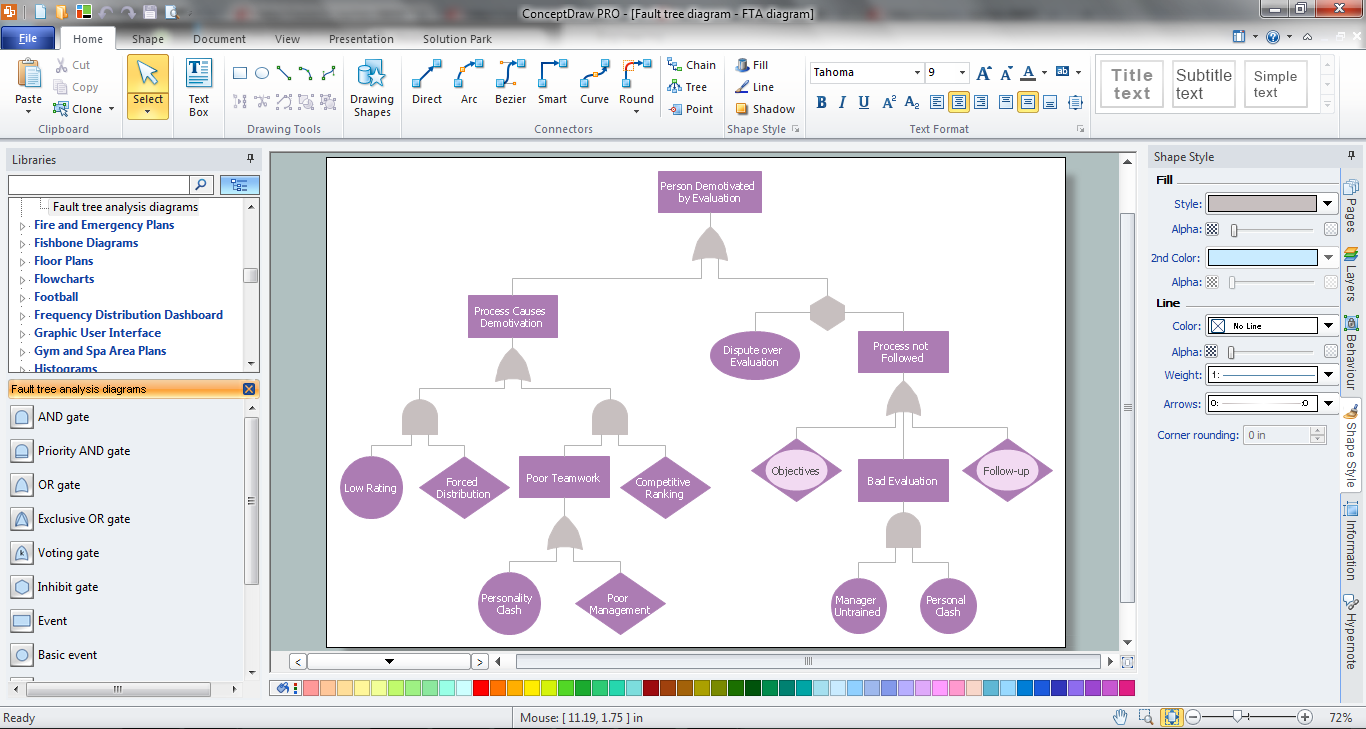
The vector stencils library "Fault tree analysis diagrams" contains 12 symbols for drawing Fault Tree Analysis (FTA) diagrams.
"Fault tree analysis (FTA) is a top down, deductive failure analysis in which an undesired state of a system is analyzed using Boolean logic to combine a series of lower-level events. This analysis method is mainly used in the fields of safety engineering and reliability engineering to understand how systems can fail, to identify the best ways to reduce risk or to determine (or get a feeling for) event rates of a safety accident or a particular system level (functional) failure. FTA is used in the aerospace, nuclear power, chemical and process, pharmaceutical, petrochemical and other high-hazard industries; but is also used in fields as diverse as risk factor identification relating to social service system failure.
In aerospace, the more general term "system Failure Condition" is used for the "undesired state" / Top event of the fault tree. These conditions are classified by the severity of their effects. The most severe conditions require the most extensive fault tree analysis. These "system Failure Conditions" and their classification are often previously determined in the functional Hazard analysis." [Fault tree analysis. Wikipedia]
The shapes example "Fault tree analysis diagrams" was created using the ConceptDraw PRO diagramming and vector drawing software extended with the Fault Tree Analysis Diagrams solution from the Engineering area of ConceptDraw Solution Park.
FTA diagram symbols

Entity Relationship Diagram Examples


3 Circle Venn Diagram. Venn Diagram Example

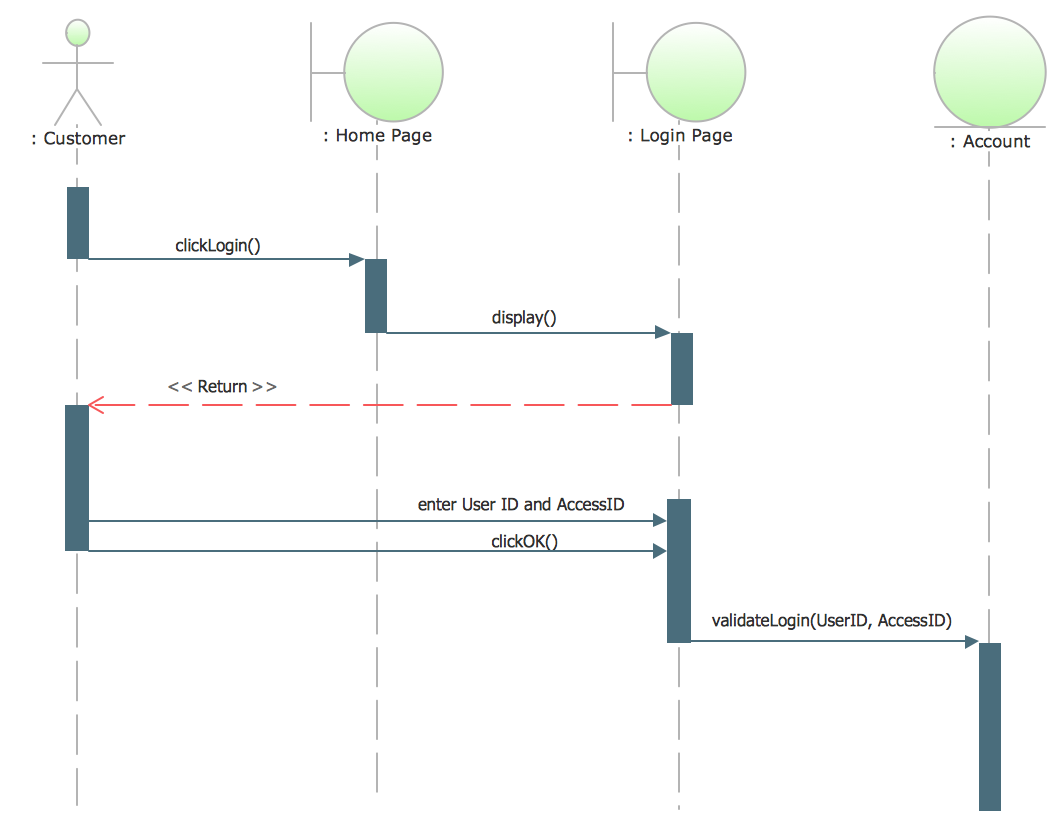
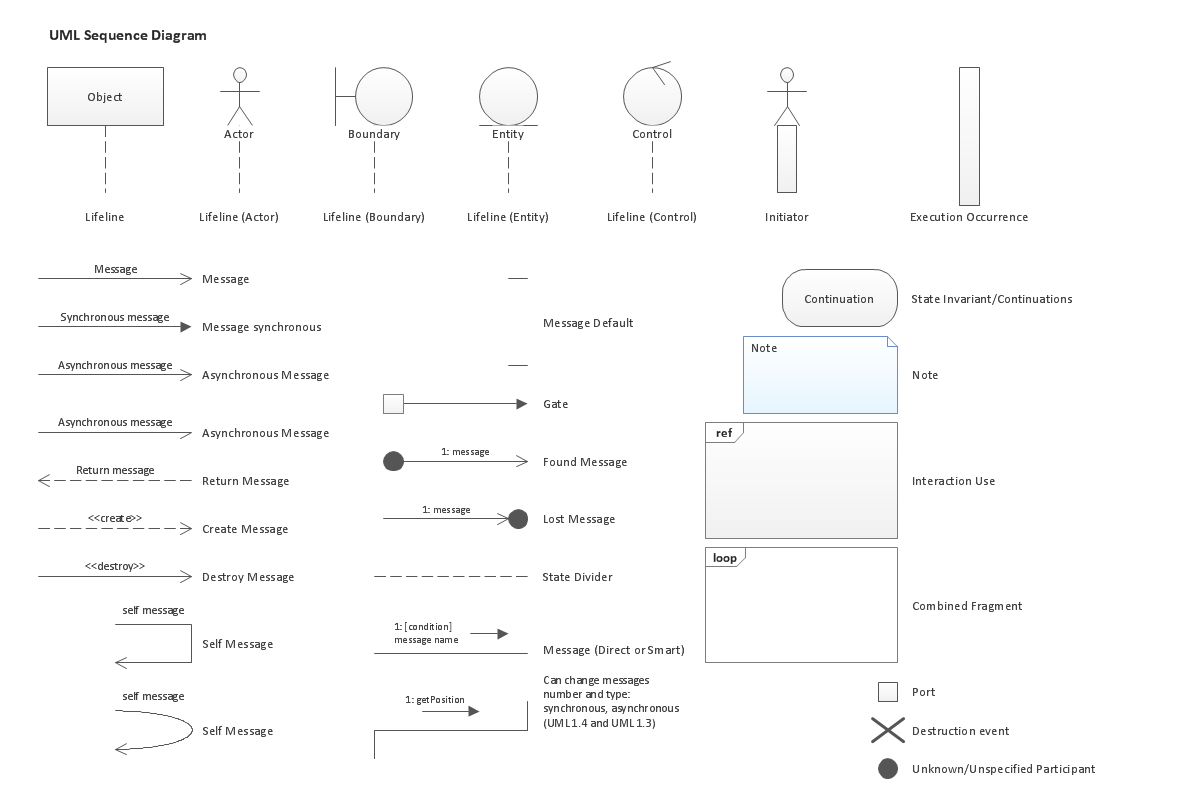
UML Sequence Diagram Example. SVG Vectored UML Diagrams Tools
Fault Tree Analysis Software
Workflow Diagram

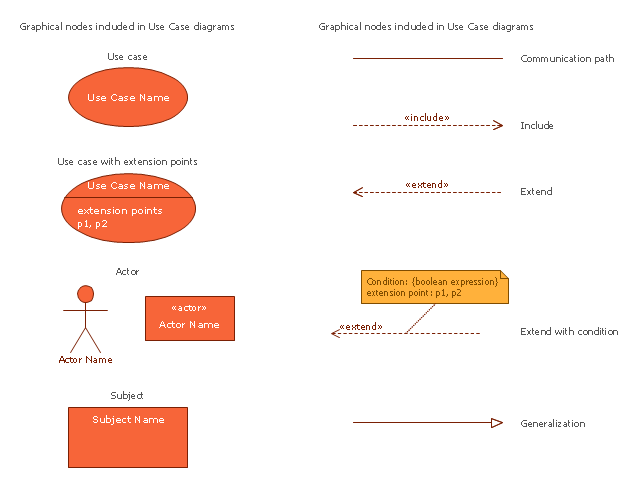
The vector stencils library "Use case diagram" contains 10 symbols.
Use it to design your use case diagrams using ConceptDraw PRO diagramming and vector drawing software.
"A use case diagram at its simplest is a representation of a user's interaction with the system that shows the relationship between the user and the different use cases in which the user is involved. A use case diagram can identify the different types of users of a system and the different use cases and will often be accompanied by other types of diagrams as well." [Use case diagram. Wikipedia]
The SysML symbols example "Design elements - Use case diagram" is included in the SysML solution from the Software Development area of ConceptDraw Solution Park.
SysML use case diagram symbols
UML Class Diagram Tutorial

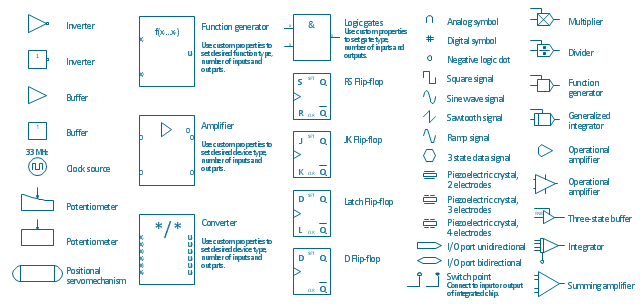
The vector stencils library "Analog and digital logic" contains 40 element symbols of logic (threshold) gates, bistable current switches, current controllers, regulators, electrical generators, and amplifiers.
Use it for drawing the digital and analog functions in electronic circuit diagrams and electrical schematics.
"Analogue electronics (or analog in American English) are electronic systems with a continuously variable signal, in contrast to digital electronics where signals usually take only two different levels. The term "analogue" describes the proportional relationship between a signal and a voltage or current that represents the signal." [Analogue electronics. Wikipedia]
"Digital electronics, or digital (electronic) circuits, represent signals by discrete bands of analog levels, rather than by a continuous range. All levels within a band represent the same signal state. Relatively small changes to the analog signal levels due to manufacturing tolerance, signal attenuation or parasitic noise do not leave the discrete envelope, and as a result are ignored by signal state sensing circuitry.
In most cases the number of these states is two, and they are represented by two voltage bands: one near a reference value (typically termed as "ground" or zero volts) and a value near the supply voltage, corresponding to the "false" ("0") and "true" ("1") values of the Boolean domain respectively.
Digital techniques are useful because it is easier to get an electronic device to switch into one of a number of known states than to accurately reproduce a continuous range of values.
Digital electronic circuits are usually made from large assemblies of logic gates, simple electronic representations of Boolean logic functions." [Digital electronics. Wikipedia]
The example "Design elements - Analog and digital logic" was drawn using the ConceptDraw PRO diagramming and vector drawing software extended with the Electrical Engineering solution from the Engineering area of ConceptDraw Solution Park.
Analog and digital logic elements
UML Sequence Diagram. Design Elements

- Logical symbols - Vector stencils library | Design elements - Logical ...
- Logical network topology diagram | Electrical Symbols — Logic Gate ...
- Electrical Symbols — Logic Gate Diagram
- Electrical Symbols , Electrical Diagram Symbols | Electrical Symbols ...
- Logic gate diagram - Template | Electrical Symbols — Logic Gate ...
- Logic gate diagram - Template | Engineering | Electrical Symbols ...
- Circuits and Logic Diagram Software | Electrical Drawing Software ...
- Electrical Symbols — Logic Gate Diagram | Circuits and Logic ...
- Electrical Symbols — Logic Gate Diagram | Logic gate diagram ...
- Electrical Symbols — Logic Gate Diagram | Design elements - Logic ...
- Logic gate diagram - Template | Electrical Symbols , Electrical ...
- Drawing Erds With Boolean Expressions
- Mechanical Drawing Symbols | Mechanical Engineering ...
- Logic gate diagram - Template | Circuits and Logic Diagram ...
- Electrical Symbols — Logic Gate Diagram | Analog and digital logic ...
- Electrical Symbols — Logic Gate Diagram | Electrical Symbols ...
- Logic gate diagram - Template | Electrical Drawing Software and ...
- Electrical Symbols — Analog and Digital Logic | Design elements ...
- Logic gate diagram
- Entity Relationship Diagram - ERD - Software for Design Crows Foot ...