Best Tool for Infographic Construction
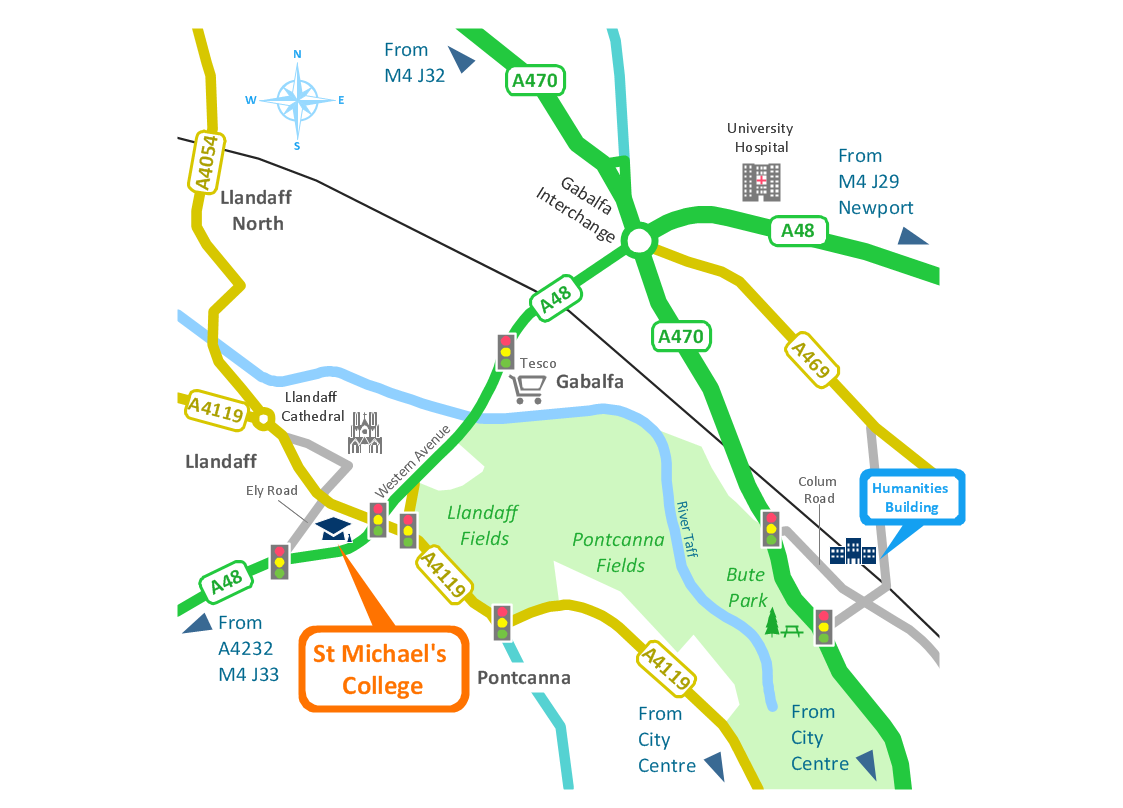
ConceptDraw is a best data visualization tool that will allow everyone to create rich infographics and visualizations quickly and easily.Map Infographic Tool
ConceptDraw is a data visualization tool, which can help you to create a map infographics. Anyone can do this, it's that easy!The Best Mac Software for Diagramming or Drawing
ConceptDraw DIAGRAM is a powerful intelligent vector graphics engine that can be used to create basic diagrams including flowcharts, charts, workflows, flowcharts, organizational charts, business diagram, learn business diagrams, flow diagrams.
Best Diagramming Software for macOS
ConceptDraw DIAGRAM creates drawings, flowcharts, block diagrams, bar charts, histograms, pie charts, divided bar diagrams, line graphs, area charts, scatter plots, circular arrows diagrams, Venn diagrams, bubble diagrams with great visual appeal on Mac OS X.
Infographic Tools
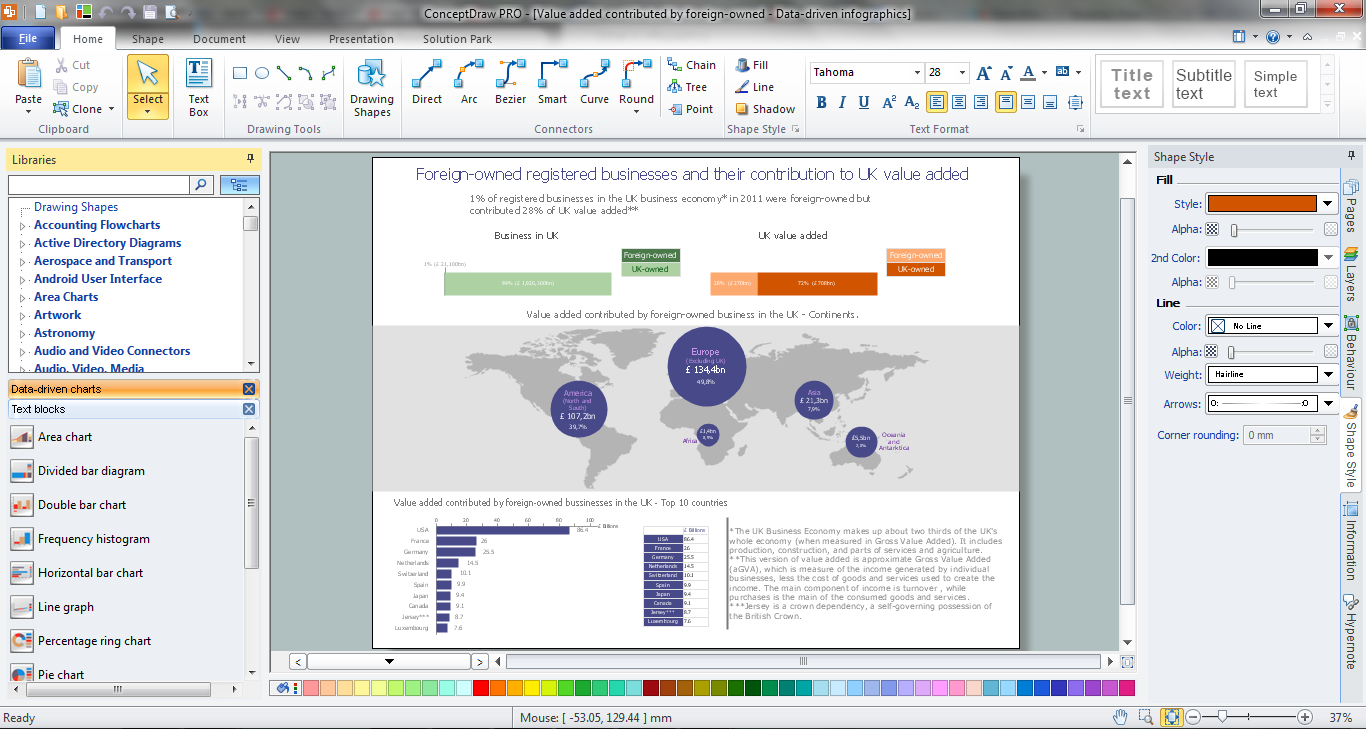
ConceptDraw DIAGRAM diagramming and vector drawing software offers the best infographic tools - Data-driven Infographics Solution from the “Infographics” Area of ConceptDraw Solution Park.ConceptDraw DIAGRAM The best Business Drawing Software
ConceptDraw DIAGRAM is new software for business and technical drawing. Powerful business drawing tools, extensive libraries with pre-drawn shapes, free samples of business drawings, technical drawings and flowcharts, support of many graphic formats enable users to visually develop their business drawings charts and diagrams in any combination of drawings, diagrams and flow charts.Cross-Functional Flowchart (Swim Lanes)
Cross-Functional Flowchart is a type of chart which shows the series of process steps connected by the arrows to depict their order and applies the swim lanes to provide an extra dimension with means of assigning each process step to certain category. Often the category or the functional unit is a stakeholder (department, person, role), resource, project, phase, or any other attribute. Cross-Functional Flowcharts visually illustrate relationships between the business processes and the functional units responsible for this processes. ConceptDraw DIAGRAM is a powerful diagramming and vector drawing software for professional design Cross-Functional Flowcharts using the common notation of shapes and swim lanes. Cross-Functional Flowcharts solution included to the Business Processes area of ConceptDraw Solution Park provides numerous well-designed vector objects and connector tools for quick, easy and effective organizing information, representing process flows and relationships, and drawing Cross-Functional Flowcharts for business, science, education, technology, etc.The Best Tool for Business Process Modeling
The EPC diagram shows various business processes in terms of work flows. Event-Driven Process chain Diagrams for improvement throughout an organisation. ConceptDraw DIAGRAM - business process mapping software that reduces the time needed to create a business process model and is excellent business process improvement tools.Data Flow Diagram Software
Data Flow Diagrams (DFDs) are successfully used when studying the business processes or systems that involve the transfer of data. They are a visual way to represent the data processing, to model and visualize the flow of data through a computer system and functional requirements for a designed system. They are the good business modeling tool to describe the business events and interactions, the physical systems involving the storage and transfer of data. ConceptDraw DIAGRAM supplied with Data Flow Diagrams solution from Software Development area of ConceptDraw Solution Park is a modern and powerful data flow diagram software. This solution offers large set of predesigned DFD vector objects, grouped to three libraries: Data Flow Diagrams, Gane-Sarson Notation, and Yourdon and Coad Notation. All they and also collection of DFD samples and built-in templates make a good base for ConceptDraw DIAGRAM users, providing them all conditions for easy creation the Data Flow Diagrams and Data Flow Models of any complexity.- Dfd Diagram Tools On Mac
- Entity Relationship Diagram Software | What's the best ERD tool for ...
- Draw Data Flow Diagram Online Free
- Best Program to Make Diagrams | Best Tool for Infographic ...
- Best Tool For Draw Erd With Chen Notation
- How to Create Data -driven Infographics | Best Tool for Infographic ...
- Draw An Er Diagram Using Word
- Top 5 Android Flow Chart Apps | Product Overview | Data structure ...
- Free Erd And Dfd Drawing Software For Mac
- Data structure diagram with ConceptDraw PRO | ConceptDraw PRO ...


