The vector stencils library "Picture Graphs" contains 4 image chart templates. Use it to design your pictorial bar charts in ConceptDraw PRO diagramming and vector drawing software.
"Pictorial bar graph.
Sometimes reffered to as a pictographs. A pictorial bar graph is a graph in which the rectangular bars have been filled with pictures, sketches, icons, etc. or where pictures, sketches, icons, etc. have been substituted for the rectangular bars. In both variations, one or more symbols might be used in each bar. The two major reasons for using pictorial graphs are to make the graph more appealing visually and to facilitate better communications." [Information Graphics: A Comprehensive Illustrated Reference. R. L. Harris. 1999. p.41]
The chart templates example "Design elements - Picture graphs" is included in the Basic Picture Graphs solution from the Graphs and Charts area of ConceptDraw Solution Park.
Pictorial chart templates

The vector stencils library "Picture bar graphs" contains 35 templates of pictorial charts. Use it for visualization of data comparison and time series with ConceptDraw PRO diagramming and vector drawing software.
"Pictorial bar graph.
Sometimes reffered to as a pictographs. A pictorial bar graph is a graph in which the rectangular bars have been filled with pictures, sketches, icons, etc. or where pictures, sketches, icons, etc. have been substituted for the rectangular bars. In both variations, one or more symbols might be used in each bar. The two major reasons for using pictorial graphs are to make the graph more appealing visually and to facilitate better communications." [Information Graphics: A Comprehensive Illustrated Reference. R. L. Harris. 1999. p.41]
The pictorial charts example "Design elements - Picture bar graphs" is included in the Picture Graphs solution from the Graphs and Charts area of ConceptDraw Solution Park.
Templates

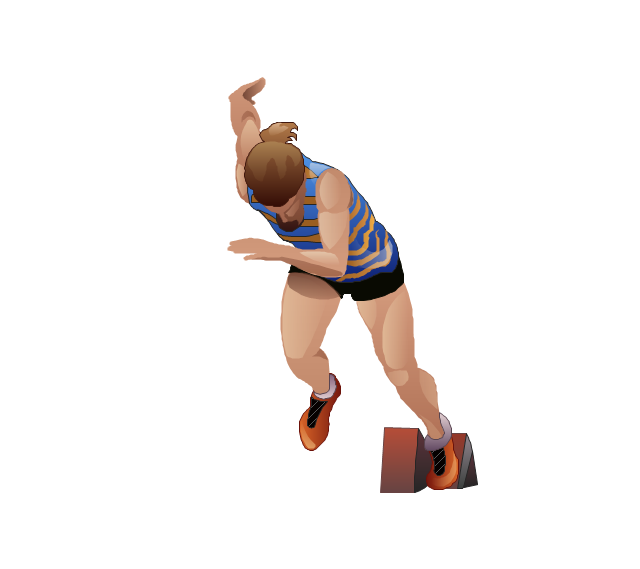
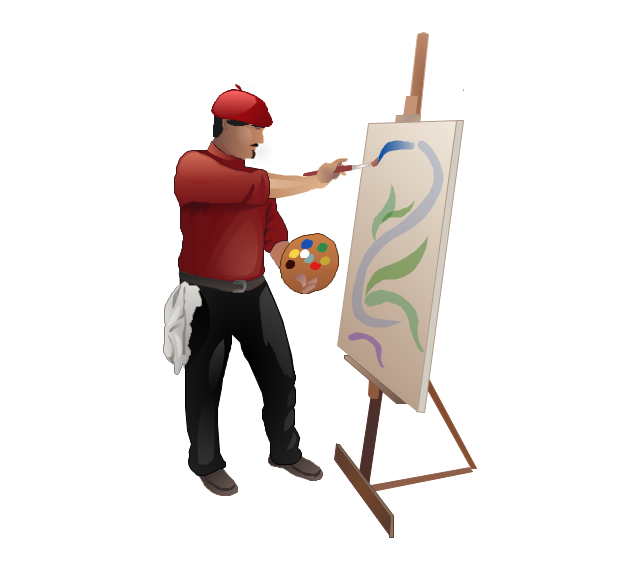
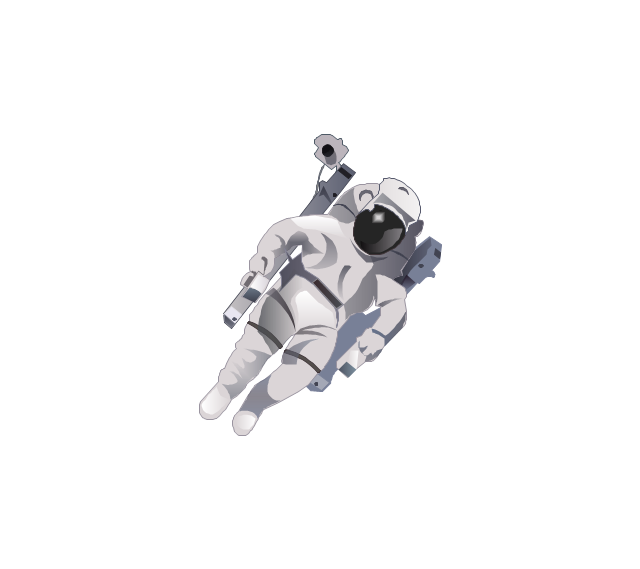
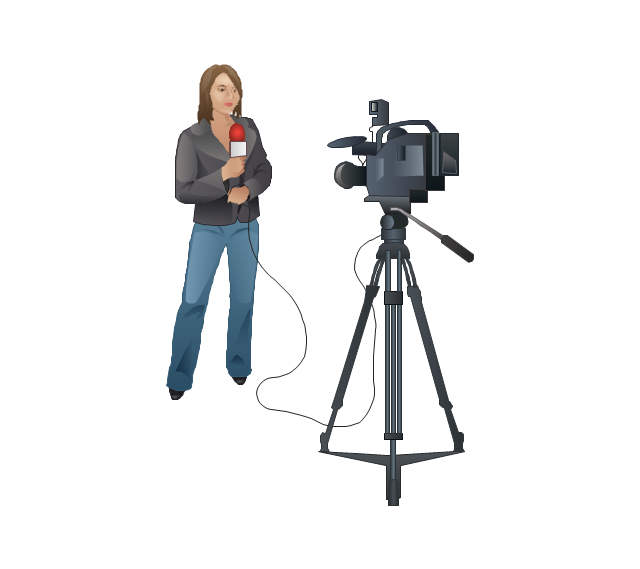
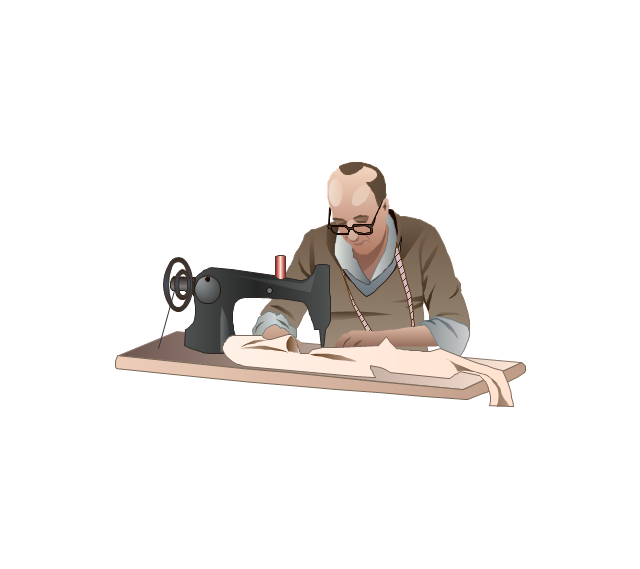
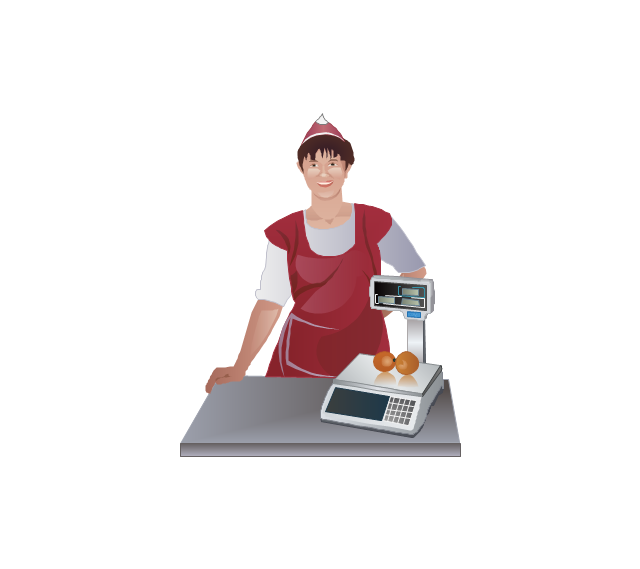
The vector stencils library "Professions" contains 58 people clipart images of different professions you can use in your presentations, illustrations and infographics.
"Electronic clip art is available in several different file formats. It is important for clip art users to understand the differences between file formats so that they can use an appropriate image file and get the resolution and detail results they need.
Clip art file formats are divided into 2 different types: bitmap or vector graphics. ...
In contrast to the grid format of bitmap images, Vector graphics file formats use geometric modeling to describe an image as a series of points, lines, curves, and polygons. Because the image is described using geometric data instead of fixed pixels, the image can be scaled to any size while retaining "resolution independence", meaning that the image can be printed at the highest resolution a printer supports, resulting in a clear, crisp image. Vector file formats are usually superior in resolution and ease of editing as compared to bitmap file formats, but are not as widely supported by software and are not well-suited for storing pixel-specific data such as scanned photographs. In the early years of electronic clip art, vector illustrations were limited to simple line art representations." [Clip art. Wikipedia]
The clip art example "Professions - Vector stencils library" was created using the ConceptDraw PRO diagramming and vector drawing software extended with the People solution from the Illustration area of ConceptDraw Solution Park.
www.conceptdraw.com/ solution-park/ illustrations-people
Builder 1

System administrator

Worker of conveyor

Clerk 1

Clerk 2

Student 2

Student 3

Student 1

Dispatcher 1

Accountant

Gardener

Lawyer

Jurist

Judge

Consultant

Manager

Director

Programmer

Architect

Pilot

Policeman

Secretary

Security officer

Clerk 3

Musician

Presenter

Athlete
Artist
Announcer

Photographer

Hairdresser

Florist

Spaceman
Engineer

Reporter
Tailor
Dispatcher 2

Biologist

Chemist

Dentist

Priest

Soldier

Doctor

Driver

Carpenter

Fireman

Seaman

Builder 2

Postman

Miner

Waiter

Cleaner

Cashier

Shop assistant
Cook

Flight attendant

Teacher

Hall porter

Draw Fishbone Diagram on MAC Software

How To Create Onion Diagram

The vector stencils library "Picture Graphs" contains 35 templates of picture bar graphs for visual data comparison and time series.
Drag a template from the library to your document, set bars number, type category labels, select bars and enter your data.
Use these shapes to draw your pictorial bar charts in the ConceptDraw PRO diagramming and vector drawing software.
The vector stencils library "Picture Graphs" is included in the Picture Graphs solution from the Graphs and Charts area of ConceptDraw Solution Park.
Arrow
Water drop

Food

Grain

Agriculture

Medicines

Houses

Buildings

Money bags

Oil barrels

Natural gas

Electrical power

Nuclear power

Mechanical engineering

Chemical industry

Mining

Gold bars

Coins

Person

Men, women and children

Man

Woman

Child

Milk

Meat

Fruits

Vegetables

Computer

Mobile phone

Airliner

Car

Bus

Truck

Train

Cargo ship

SIPOC Diagram

How to Draw a Computer Network Diagrams

Network Diagram Software. LAN Network Diagrams. Physical Office Network Diagrams


Basic Diagramming


The vector stencils library "Picture Graphs" contains 35 templates of picture bar graphs for visual data comparison and time series.
Drag a template from the library to your document, set bars number, type category labels, select bars and enter your data.
Use these shapes to draw your pictorial bar charts in the ConceptDraw PRO diagramming and vector drawing software.
The vector stencils library "Picture Graphs" is included in the Picture Graphs solution from the Graphs and Charts area of ConceptDraw Solution Park.
Drag a template from the library to your document, set bars number, type category labels, select bars and enter your data.
Use these shapes to draw your pictorial bar charts in the ConceptDraw PRO diagramming and vector drawing software.
The vector stencils library "Picture Graphs" is included in the Picture Graphs solution from the Graphs and Charts area of ConceptDraw Solution Park.
Arrow
Water drop
Food
Grain
Agriculture
Medicines
Houses
Buildings
Money bags
Oil barrels
Natural gas
Electrical power
Nuclear power
Mechanical engineering
Chemical industry
Mining
Gold bars
Coins
Person
Men, women and children
Man
Woman
Child
Milk
Meat
Fruits
Vegetables
Computer
Mobile phone
Airliner
Car
Bus
Truck
Train
Cargo ship
Personal area (PAN) networks. Computer and Network Examples
 networks")
Business diagrams & Org Charts with ConceptDraw DIAGRAM


Basic Diagramming

 Website Wireframe
The innovative Website Wireframe solution enhances the ConceptDraw DIAGRAM functionality with newest wireframe tools, libraries with variety of predesigned icons, symbols, buttons, graphics, forms, boxes, and many other vector elements, templates and professionally designed samples, which make it the best wireframing software. Website Wireframe solution gives you significant advantages when designing and maintaining websites, creating skeletal and content-free depictions of website structure, making website prototypes and planning the content arrangement before committing to design, also speeds up the processes of sketching, producing and sharing wireframe examples of website style and interface design.
Soccer (Football) Illustrated
 Illustrated *")
How to Draw an Organization Chart

Bar Chart Software

Examples of Flowcharts, Org Charts and More


- Make Use Of Appropriate Graphics Graphs Photographs Sketches ...
- Make Use Of Appropriate Graphics Graphs Photographs Sketches
- Make Use Of Appropriate Graphics Graphs Photographs Sketches ...
- Make Use Of Appropriate Graphics Graphs Photographs Sketches ...
- The Appropriate Graphics Graphs Photographs Sketches Of Gold ...
- What And How Appropriate Graphics Graphs Photographs Sketches
- Make Use Of Appropriate Graphics Graphs Sketches Photographs ...
- Use Of Appropriate Graphics Graphs Photographs Sketches Of Gold ...
- Make Use Of Appropriate Graphics Graphs Photographs Sketches ...
- eLearning for Skype | Graphs Photographs Of Gold Mine
- Mine Gold Appropriate Graphics Photographys Sketches
- Local area network (LAN). Computer and Network Examples ...
- Process Flowchart | Basic Flowchart Symbols and Meaning ...
- Make Use Of Appropriate Graphics Cgraphs Photographys Sketches ...
- Pie Charts | Geo Map — USA — Montana | Picture Graphs | Make ...
- Picture Graphs | Nature Drawings - How to Draw | Local area ...
- Design elements - Picture bar graphs | Picture Graph Or Pictograph
- Picture Graphs | Design elements - Picture bar graphs | How to ...
- Picture Graph
- Design elements - Picture graphs | Picture graph - Template | Picture ...