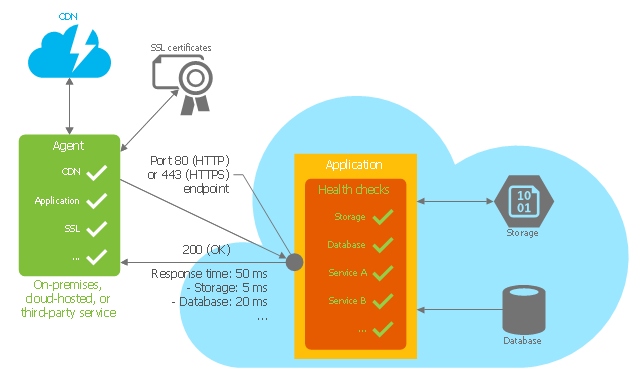
This Azure cloud architecture pattern diagram template was created on the base of figure in the article "Health Endpoint Monitoring Pattern" from the Microsoft Developer Network (MSDN) website.
"Health Endpoint Monitoring Pattern.
Implement functional checks within an application that external tools can access through exposed endpoints at regular intervals. This pattern can help to verify that applications and services are performing correctly. ...
It is good practice—and often a business requirement—to monitor web applications, and middle-tier and shared services, to ensure that they are available and performing correctly. However, it is more difficult to monitor services running in the cloud than it is to monitor on-premises services. ...
Implement health monitoring by sending requests to an endpoint on the application. The application should perform the necessary checks, and return an indication of its status.
A health monitoring check typically combines two factors: the checks (if any) performed by the application or service in response to the request to the health verification endpoint, and analysis of the result by the tool or framework that is performing the health verification check. The response code indicates the status of the application and, optionally, any components or services it uses. The latency or response time check is performed by the monitoring tool or framework." [msdn.microsoft.com/ ru-RU/ library/ dn589789.aspx]
The Azure cloud system architecture diagram template "Health endpoint monitoring pattern" for the ConceptDraw PRO diagramming and vector drawing software is included in the Azure Architecture solutin from the Computer and Networks area of ConceptDraw Solution Park.
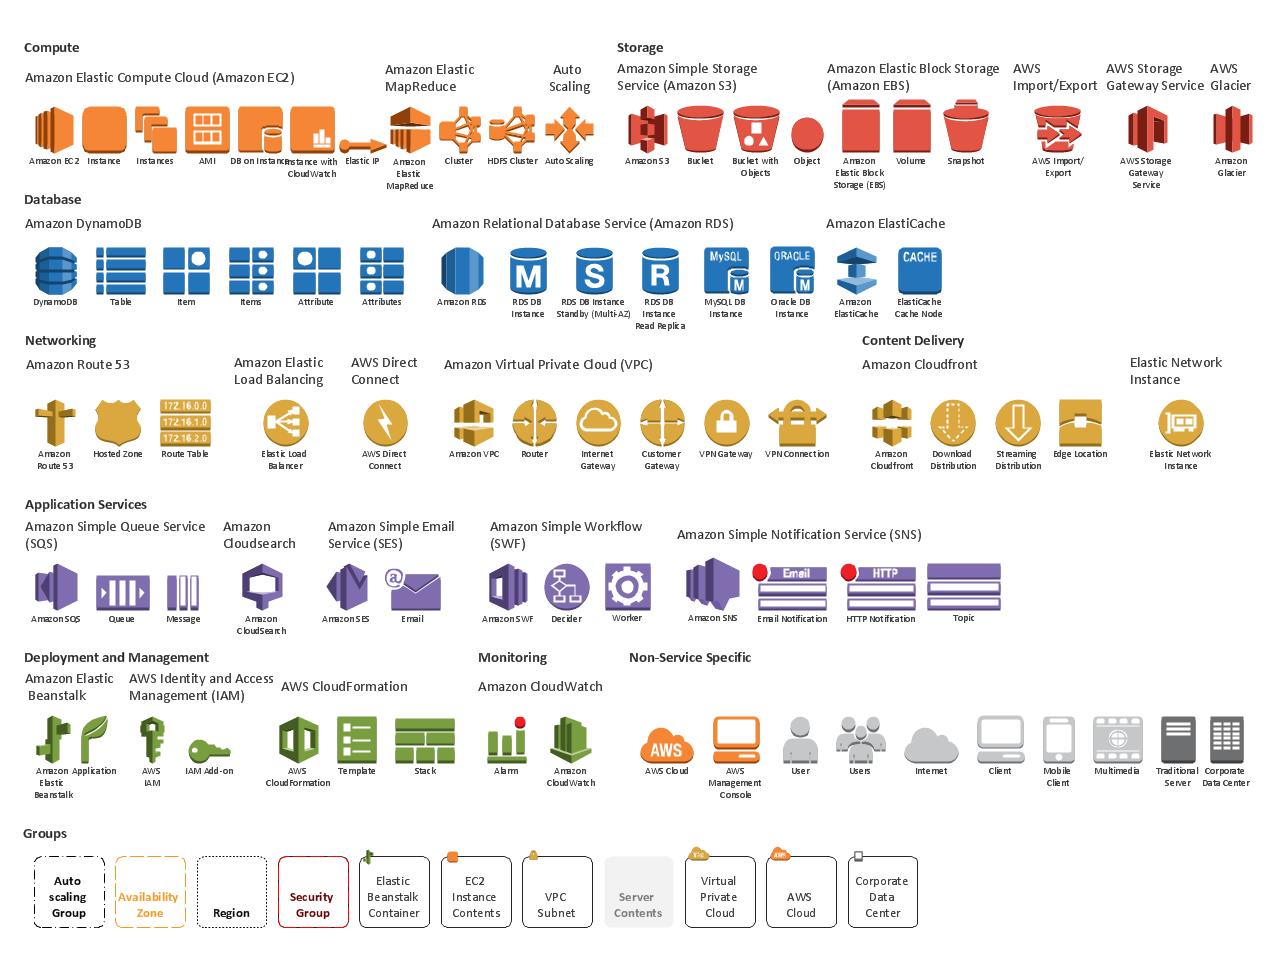
AWS icons 2.0
ConceptDraw Solution Park includes AWS architecture solution for creating Web Application Architectures.Network Diagram Software ISG Network Diagram
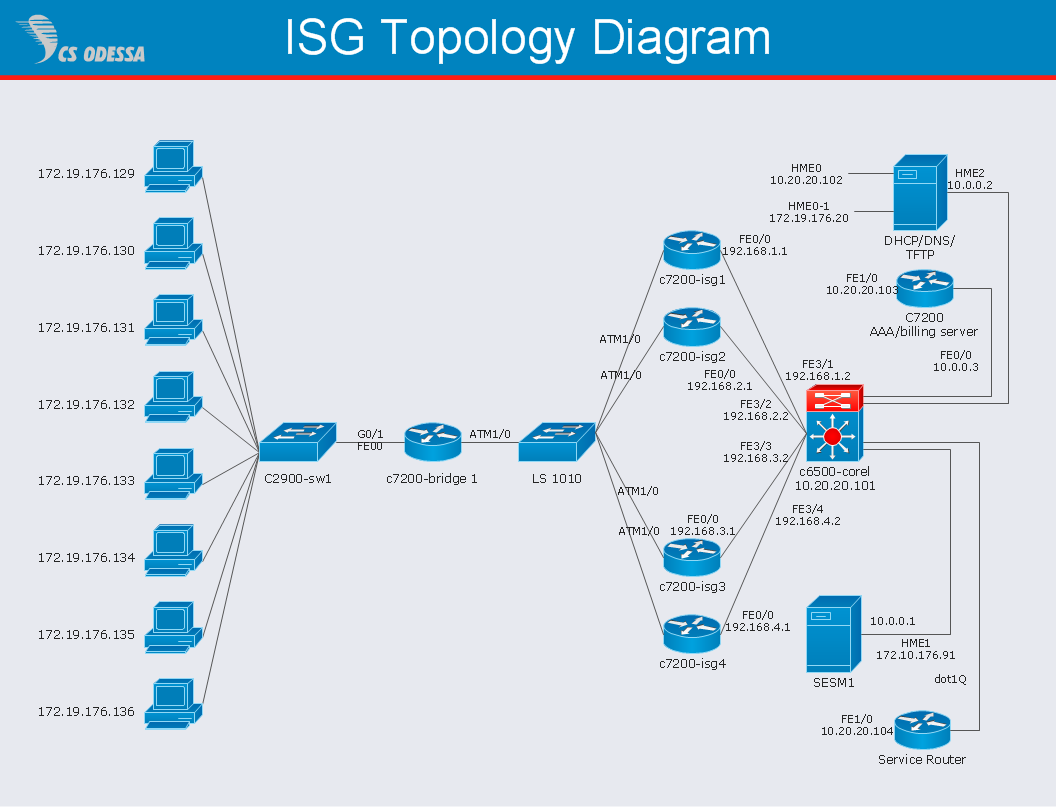
Drawing ISG Network Diagram using ConceptDraw PRO stencils
 AWS Architecture Diagrams
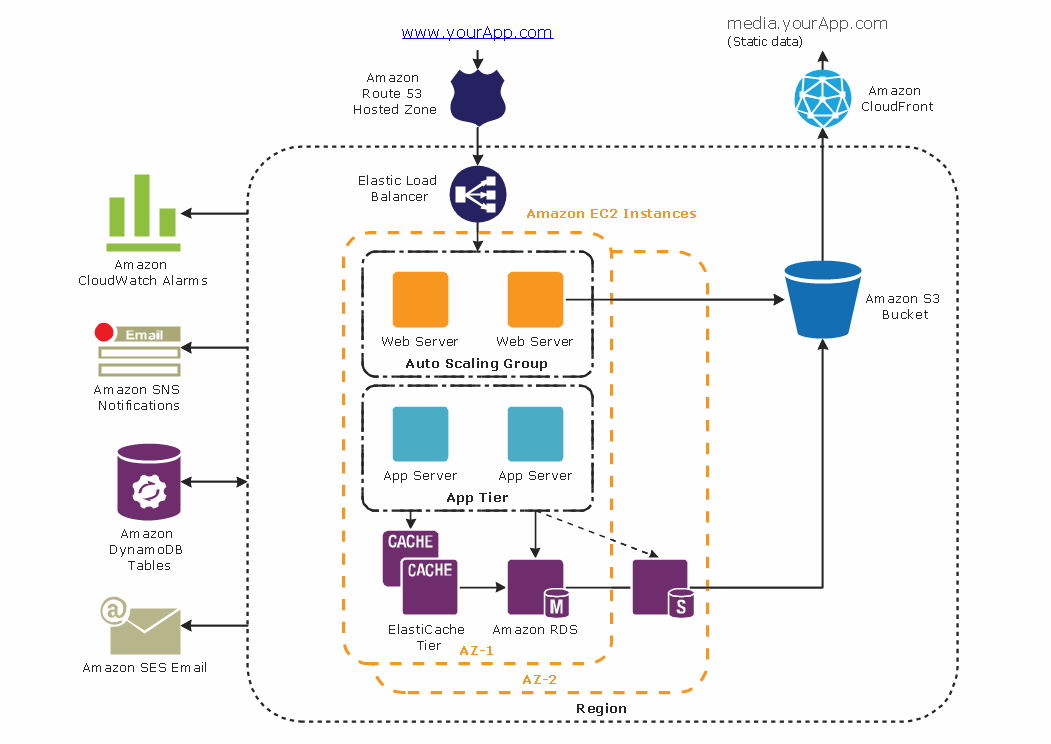
AWS Architecture Diagrams with powerful drawing tools and numerous predesigned Amazon icons and AWS simple icons is the best for creation the AWS Architecture Diagrams, describing the use of Amazon Web Services or Amazon Cloud Services, their application for development and implementation the systems running on the AWS infrastructure. The multifarious samples give you the good understanding of AWS platform, its structure, services, resources and features, wide opportunities, advantages and benefits from their use; solution’s templates are essential and helpful when designing, description and implementing the AWS infrastructure-based systems. Use them in technical documentation, advertising and marketing materials, in specifications, presentation slides, whitepapers, datasheets, posters, etc.
ER Diagram for Cloud Computing
The entity–relationship (ER) model is a data model that lets graphically represent the information system and depict the relationships between people, objects, concepts, places, and events within a given system. It is also convenient to use the ER Diagram for Cloud computing representation and description the Cloud computing architecture, design them with pleasure using the extensive tools of the Cloud Computing Diagrams solution from the Computers and Network area of ConceptDraw Solution Park.Network Security Architecture Diagram
Network Security Architecture Diagram visually reflects the network's structure and construction, and all actions undertaken for ensuring the network security which can be executed with help of software resources and hardware devices. You dream to find powerful software for easy designing Network Security Architecture Diagram? We recommend to use ConceptDraw PRO extended with Network Security Diagrams Solution from the Computer and Networks Area of ConceptDraw Solution Park.Flowchart
The Flowcharts are widespread in various fields and include the multitude of types. They are dedicated to representation the algorithms, processes, workflows of any complexity in a clear and intuitive format. The Flowcharts are commonly used in software development as a visual tool for illustration algorithms and logic of computer programs, in business for illustration business scenarios, in education, and so on. For drawing the Flowchart are used the special object blocks, among them rectangle or box used to represent an activity or step, rounded box or oval to depict Start / End, diamond to represent the decision point (involves the branching yes/no), circle used to represent the point of connection, parallelogram to represent the Input / Output, and some others. With ConceptDraw PRO including Flowcharts solution it is easy to create professional-looking Flowchart diagrams of any complexity and any degree of detailing. Succeed in drawing the Flowcharts using quick-start templates, predesigned samples and extensive libraries of ready-made flowchart symbols, blocks and icons.Cisco LAN. Cisco icons, shapes, stencils and symbols
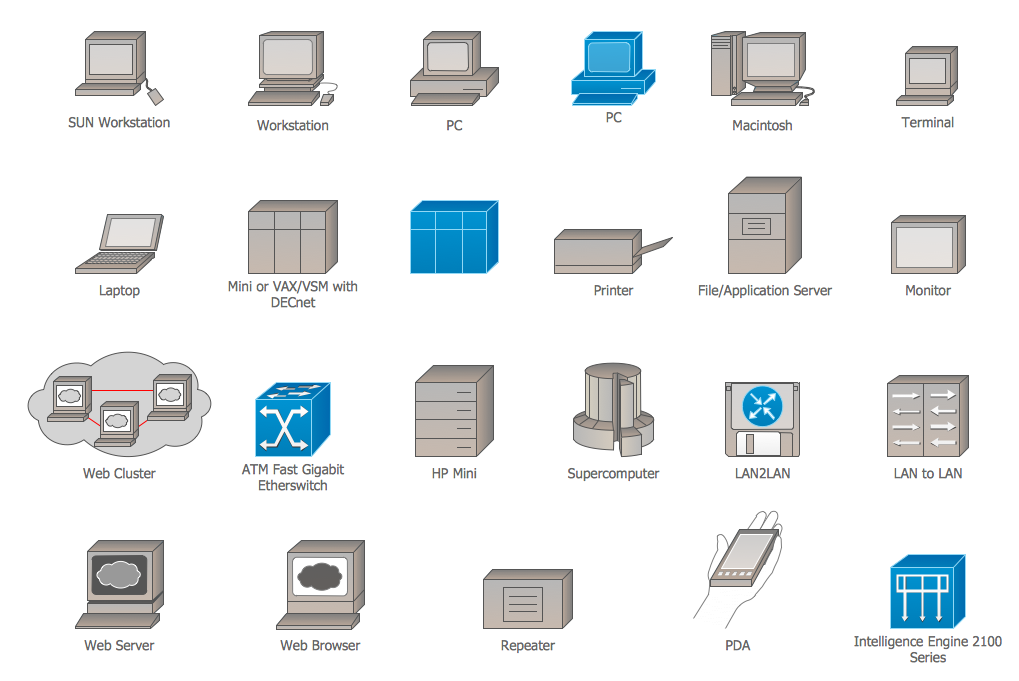
The ConceptDraw vector stencils library Cisco LAN contains symbols for drawing the computer local area network diagrams.
 Entity-Relationship Diagram (ERD)
Entity-Relationship Diagram (ERD) solution extends ConceptDraw PRO software with templates, samples and libraries of vector stencils from drawing the ER-diagrams by Chen's and crow’s foot notations.
AWS
The AWS diagrams are convenient way for explaining the work of Amazon Web Services. ConceptDraw PRO diagramming and vector drawing software offers the AWS Architecture Diagrams Solution from the Computer and Networks Area for fast and easy creating the AWS diagrams of any complexity.How To use House Electrical Plan Software
How we can conduct the electricity at house correctly without a plan? It is impossible. The House electrical diagram depicts locations of switches, outlets, dimmers and lights, and lets understand how you will connect them. But design of House Electrical Plan looks a complex task at a glance, which requires a lot of tools and special experience. But now all is simple with all-inclusive floor plan software - ConceptDraw PRO. As a house electrical plan software, the ConceptDraw PRO contains libraries with a large range of professional lighting and electrical symbols, ready-to-use electrical plans samples and examples, and built-in templates for creating great-looking Home floor electrical plans. It is a fastest way to draw Electrical circuit diagrams, Electrical wiring and Circuit schematics, Digital circuits, Electrical equipment, House electrical plans, Satellite television, Cable television, Home cinema, Closed-circuit television when are used the tools of Electric and Telecom Plans Solution from ConceptDraw Solution Park. Files created in Visio for Mac app can be easily imported to ConceptDraw PRO. Also you may import stencils and even libraries. Try for free an alternative to Visio that Apple users recommend.
Diagramming software for Amazon Web Service icon set: Networking and Content Delivery
Networking and Content Delivery icons - Amazon AWS pro diagrams - AWS diagrams are part of architecturing tools provided with ConceptDraw Solution Park.The vector stencils library "AWS Analytics" contains 22 icons: Amazon Athena icon, Amazon CloudSearch icons, Amazon EMR icons, Amazon ES icons, Amazon Kinesis icons, Amazon QuickSight icon, Amazon Redshift icons, AWS Data Pipeline icon, AWS Glue icon.
Use it to draw Amazon Web Services architecture diagrams with ConceptDraw PRO diagramming and vector drawing software.
"Amazon Elasticsearch Service is a managed service that makes it easy to deploy, operate, and scale Elasticsearch in the AWS Cloud. Elasticsearch is a popular open-source search and analytics engine for use cases such as log analytics, real-time application monitoring, and click stream analytics." [aws.amazon.com/ elasticsearch-service/ ]
"Amazon Elastic MapReduce (Amazon EMR) is a web service that makes it easy to quickly and cost-effectively process vast amounts of data." [aws.amazon.com/ elasticmapreduce/ ]
"Amazon Kinesis is a platform for streaming data on AWS, offering powerful services to make it easy to load and analyze streaming data, and also providing the ability for you to build custom streaming data applications for specialized needs." [aws.amazon.com/ kinesis/ ]
"Amazon Machine Learning is a service that makes it easy for developers of all skill levels to use machine learning technology." [aws.amazon.com/ machine-learning/ ]
"Amazon QuickSight is a very fast, cloud-powered business intelligence (BI) service that makes it easy for all employees to build visualizations, perform ad-hoc analysis, and quickly get business insights from their data." [aws.amazon.com/ quicksight/ ]
"AWS Data Pipeline is a web service that helps you reliably process and move data between different AWS compute and storage services, as well as on-premise data sources, at specified intervals." [aws.amazon.com/ datapipeline/ ]
The AWS icons example "Design elements - AWS Analytics" is included in the AWS Architecture Diagrams solution from the Computer and Networks area of ConceptDraw Solution Park.
This interactive voice response (IVR) diagram sample depicts the architecture of IVR systems. It was designed on the base of the Wikimedia Commons file: IVR-Systemarchitektur.png. [commons.wikimedia.org/ wiki/ File:IVR-Systemarchitektur.png]
This file is licensed under the Creative Commons Attribution-Share Alike 3.0 Unported license. [creativecommons.org/ licenses/ by-sa/ 3.0/ deed.en]
"DTMF decoding and speech recognition are used to interpret the caller's response to voice prompts. DTMF tones are entered via the telephone keypad. ...
Other technologies include using text-to-speech (TTS) to speak complex and dynamic information, such as e-mails, news reports or weather information. TTS is computer generated synthesized speech that is no longer the robotic voice traditionally associated with computers. Real voices create the speech in fragments that are spliced together (concatenated) and smoothed before being played to the caller.
An IVR can be deployed in several ways:
1. Equipment installed on the customer premises.
2. Equipment installed in the PSTN (public switched telephone network).
3. Application service provider (ASP) / hosted IVR.
IVR can be used to provide a more sophisticated voice mail experience to the caller. ...
An automatic call distributor (ACD) is often the first point of contact when calling many larger businesses. ...
IVR call flows are created in a variety of ways. A traditional IVR depended upon proprietary programming or scripting languages, whereas modern IVR applications are generated in a similar way to Web pages, using standards such as VoiceXML, CCXML, SRGS and SSML. ...
In telecommunications, an audio response unit (ARU) is a device that provides synthesized voice responses to DTMF keypresses by processing calls based on (a) the call-originator input, (b) information received from a database, and (c) information in the incoming call, such as the time of day.
ARUs increase the number of information calls handled and provide consistent quality in information retrieval." [Interactive voice response. Wikipedia]
The IVR diagram example "IVR systems architecture" was designed using ConceptDraw PRO diagramming and vector drawing software extended with the Interactive Voice Response Diagrams solution from the Computer and Networks area of ConceptDraw Solution Park.
Technical Flow Chart
Flow chart is a diagrammatic representation of an algorithm and essential part of planning the system. Flow charts are widely used in technical analysis and programming for easy writing programs and explaining them to others. So, one of the most popular type of flow charts is Technical Flow Chart. Technical Flow Chart can be drawn by pencil on the paper, but it will be easier to use for designing a special software. ConceptDraw PRO diagramming and vector drawing software extended with Flowcharts Solution from the "Diagrams" Area of ConceptDraw Solution Park will be useful for this goal.- AWS Architecture Diagrams | Health endpoint monitoring pattern ...
- Health endpoint monitoring pattern | Cloud Computing Diagrams ...
- Health endpoint monitoring pattern | Process Flow Diagram ...
- IDEF0 Diagrams | Azure Architecture | Health endpoint monitoring ...
- Enterprise Architecture Diagrams | Network Architecture | Health ...
- System Architecture Diagram For Web Application
- Health endpoint monitoring pattern | Windows Azure | AWS ...
- AWS Architecture Diagrams | AWS | AWS Simple Icons for ...
- Cloud Computing Architecture Diagrams | Competing consumers ...
- AWS Architecture Diagrams | Diagramming software for Amazon ...
- Content Delivery Network Diagram
- Flowchart | Flowchart Definition | Process Flow Diagram | Monitoring ...
- Azure Architecture | How to Create an Azure Architecture Diagram ...
- Step chart - Cloud testing steps | Workitems workflow diagram | ER ...
- Health endpoint monitoring pattern | Structured Systems Analysis ...
- AWS Architecture Diagrams | Presentation For Desktop Monitoring ...
- Er Diagram For Project Monitoring System
- Lan Monitering Er Diagram
- Cdn Architecture Diagram
- Entity-Relationship Diagram (ERD) | ER Diagram for Cloud ...
