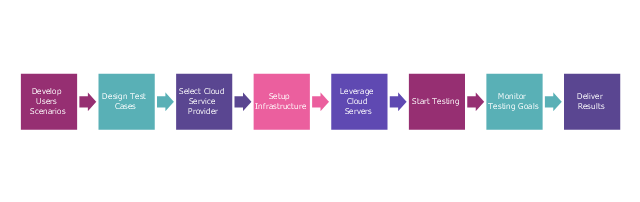
This step diagram example shows cloud testing steps. It was redesigned from the Wikimedia Commons file: Cloud Testing steps.png. [commons.wikimedia.org/ wiki/ File:Cloud_ Testing_ steps.png]
This file is licensed under the Creative Commons Attribution-Share Alike 3.0 Unported license. [creativecommons.org/ licenses/ by-sa/ 3.0/ deed.en]
"Cloud testing is a form of software testing in which web applications use cloud computing environments (a "cloud") to simulate real-world user traffic. ...
Cloud Testing uses cloud infrastructure for software testing. Organizations pursuing testing in general and load, performance testing and production service monitoring in particular are challenged by several problems like limited test budget, meeting deadlines, high costs per test, large number of test cases, and little or no reuse of tests and geographical distribution of users add to the challenges. Moreover ensuring high quality service delivery and avoiding outages requires testing in one's datacenter, outside the data-center, or both. Cloud Testing is the solution to all these problems. Effective unlimited storage, quick availability of the infrastructure with scalability, flexibility and availability of distributed testing environment reduce the execution time of testing of large applications and lead to cost-effective solutions." [Cloud testing. Wikipedia]
The step chart example "Cloud testing steps" was created using the ConceptDraw PRO diagramming and vector drawing software extended with the Marketing Diagrams solution from the Marketing area of ConceptDraw Solution Park.
Marketing diagram
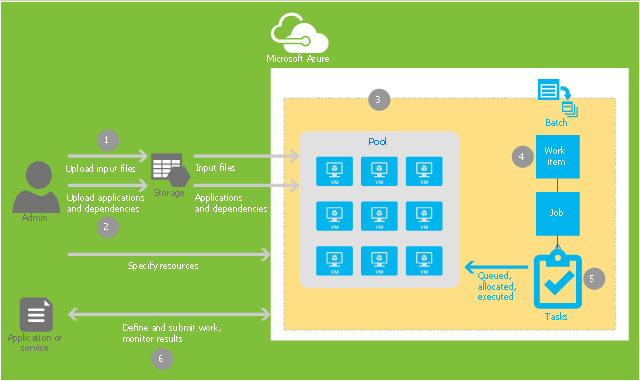
This example of cloud computing system architecture diagram was created on base of the figure "Workflow to distribute workitems to pooled VMs" in the article "Azure Batch technical overview" from the Microsoft Azure website.
"Workitems workflow.
Figure 4 shows a you how to submit an application to a pool where it's distributed for processing. This uses the Batch API. ...
1. Upload input files (such as source data or images) required for a job to an Azure storage account. These files must be in the storage account so that the Batch service can access them. The Batch service loads them onto a TVM when the task runs.
2. Upload the dependent binary files to the storage account. The binary files include the program that is run by the task and the dependent assemblies. These files must also be accessed from storage and are loaded onto the TVM.
3. Create a pool of TVMs, specifying the size of the TVMs in the pool, the OS they run, and other properties. When a task runs, it is assigned a TVM from this pool.
4. Create a workitem. A job will be automatically created when you create a workitem. A workitem enables you to manage a job of tasks.
5. Add tasks to the job. Each task uses the program that you uploaded to process information from a file you uploaded.
6. Run the application and monitor the results of the output." [azure.microsoft.com/ en-us/ documentation/ articles/ batch-technical-overview/ ]
The diagram example "Workitems workflow diagram" was created using ConceptDraw PRO diagramming and vector drawing software extended with the Azure Architecture solution from the Computer and Networks area of ConceptDraw Solution Park.
Cloud computing system architecture diagram
ER Diagram for Cloud Computing

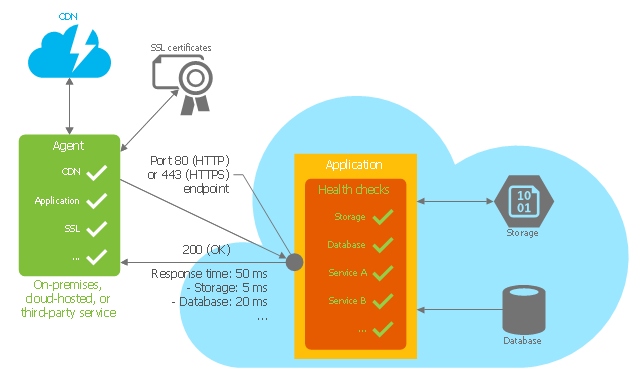
This Azure cloud architecture pattern diagram template was created on the base of figure in the article "Health Endpoint Monitoring Pattern" from the Microsoft Developer Network (MSDN) website.
"Health Endpoint Monitoring Pattern.
Implement functional checks within an application that external tools can access through exposed endpoints at regular intervals. This pattern can help to verify that applications and services are performing correctly. ...
It is good practice—and often a business requirement—to monitor web applications, and middle-tier and shared services, to ensure that they are available and performing correctly. However, it is more difficult to monitor services running in the cloud than it is to monitor on-premises services. ...
Implement health monitoring by sending requests to an endpoint on the application. The application should perform the necessary checks, and return an indication of its status.
A health monitoring check typically combines two factors: the checks (if any) performed by the application or service in response to the request to the health verification endpoint, and analysis of the result by the tool or framework that is performing the health verification check. The response code indicates the status of the application and, optionally, any components or services it uses. The latency or response time check is performed by the monitoring tool or framework." [msdn.microsoft.com/ ru-RU/ library/ dn589789.aspx]
The Azure cloud system architecture diagram template "Health endpoint monitoring pattern" for the ConceptDraw PRO diagramming and vector drawing software is included in the Azure Architecture solutin from the Computer and Networks area of ConceptDraw Solution Park.
Cloud computing system architecture diagram template
Network Topologies


 Computer Network Diagrams
Computer Network Diagrams solution extends ConceptDraw DIAGRAM software with samples, templates and libraries of vector icons and objects of computer network devices and network components to help you create professional-looking Computer Network Diagrams, to plan simple home networks and complex computer network configurations for large buildings, to represent their schemes in a comprehensible graphical view, to document computer networks configurations, to depict the interactions between network's components, the used protocols and topologies, to represent physical and logical network structures, to compare visually different topologies and to depict their combinations, to represent in details the network structure with help of schemes, to study and analyze the network configurations, to communicate effectively to engineers, stakeholders and end-users, to track network working and troubleshoot, if necessary.
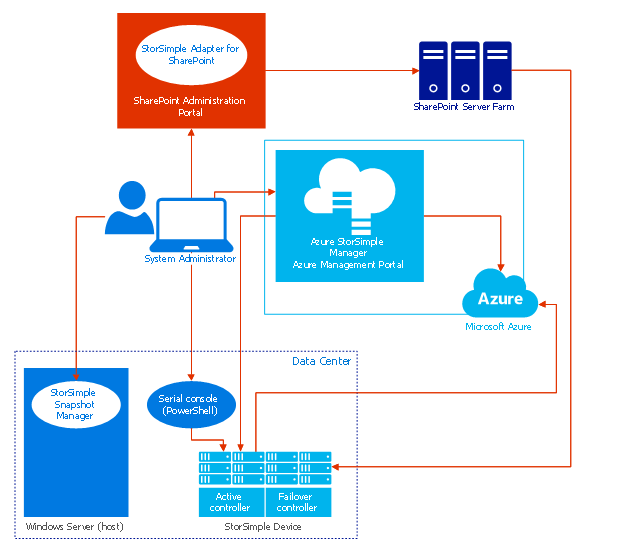
This example of cloud computing system architecture diagram was created on the base of picture in the article "What is StorSimple?" by Sharon Smith from the Microsoft Azure website.
"Microsoft Azure StorSimple is an efficient, cost-effective, and manageable solution that eliminates many of the issues and expense associated with enterprise storage and data protection. It uses a proprietary device (the Microsoft Azure StorSimple device) and integrated management tools to provide a seamless view of all enterprise storage, including cloud storage." [azure.microsoft.com/ en-us/ documentation/ articles/ storsimple-overview/ ]
The diagram example "Microsoft Azure StorSimple architecture" was created using ConceptDraw PRO diagramming and vector drawing software extended with the Azure Architecture solution from the Computer and Networks area of ConceptDraw Solution Park.
Cloud computing system architecture diagram
 Fault Tree Analysis Diagrams
This solution extends ConceptDraw DIAGRAM.5 or later with templates, fault tree analysis example, samples and a library of vector design elements for drawing FTA diagrams (or negative analytical trees), cause and effect diagrams and fault tree diagrams.
 Reflected Ceiling Plans
Reflected Ceiling Plans solution extends greatly the ConceptDraw DIAGRAM functionality with samples, templates and libraries of design elements for displaying the ceiling ideas for living room, bedroom, classroom, office, shop, restaurant, and many other premises. It is an effective tool for architects, designers, builders, electricians, and other building-related people to represent their ceiling design ideas and create Reflected Ceiling plan or Reflective Ceiling plan, showing the location of light fixtures, lighting panels, drywall or t-bar ceiling patterns, HVAC grilles or diffusers that may be suspended from the ceiling. Being professional-looking and vivid, these plans perfectly reflect your ceiling ideas and can be presented to the client, in reports, in presentations, on discussions with colleagues, or successfully published in modern print or web editions.
 Cisco Network Diagrams
Cisco Network Diagrams solution extends ConceptDraw DIAGRAM with the best characteristics of network diagramming software. Included samples, templates and libraries of built-in standardized vector Cisco network icons and Cisco symbols of computers, network devices, network appliances and other Cisco network equipment will help network engineers, network designers, network and system administrators, as well as other IT professionals and corporate IT departments to diagram efficiently the network infrastructure, to visualize computer networks topologies, to design Cisco computer networks, and to create professional-looking Cisco Computer network diagrams, Cisco network designs and schematics, Network maps, and Network topology diagrams in minutes.
 Dashboards Area
Solutions from the area Dashboards of ConceptDraw Solution Park collects templates, samples and vector stencils libraries with of data driven charts and indicators for drawing the basic types of Visual Dashboards.
 Sales Flowcharts
The Sales Flowcharts solution lets you create and display sales process maps, sales process workflows, sales steps, the sales process, and anything else involving sales process management.
- Cloud Computing . Computer and Network Examples | Mobile cloud ...
- Azure Storage | Azure Management | Azure Services | Azure ...
- Cloud Computing Provider
- Cloud Computing . Computer and Network Examples | Roaming ...
- Conceptdraw.com: Mind Map Software, Drawing Tools | Project ...
- Amazon Cloud | Cloud Computing | Mobile cloud architecture ...
- 3-Tier Auto-scalable Web Application Architecture | 2-Tier Auto ...
- AWS Architecture Diagrams | AWS icons 2.0 | Mobile cloud ...
- 3-Tier Auto-scalable Web Application Architecture | Amazon Web ...
- Azure Architecture | How to Create an Azure Architecture Diagram ...
- Microsoft Azure | Azure Architecture | Microsoft Azure reference ...
- Azure Storage | Workitems workflow diagram | Microsoft Azure ...
- How to Create an Azure Architecture Diagram Using ConceptDraw
- Mobile cloud architecture diagram | AWS Architecture Diagrams ...
- Workitems workflow diagram | Competing consumers pattern | Valet ...
- How to Draw a Computer Network Diagrams | Computer Network ...
- Computer Network Diagrams | Computer and Networks Area | Cloud ...
- Microsoft Azure reference architecture | Microsoft Azure network and ...
- Cisco Routers. Cisco icons, shapes, stencils and symbols | Network ...
- Architecture Diagram For Web Application