Basic Flowchart Symbols and Meaning


Chart Templates

Chart Examples

This arrow ring chart sample was created on the base of the figure illustrating the webpage "National Preparedness Cycle. Plan" from the Federal Emergency Management Agency (FEMA) website. "Planning makes it possible to manage the entire life cycle of a potential crisis. Strategic and operational planning establishes priorities, identifies expected levels of performance and capability requirements, provides the standard for assessing capabilities and helps stakeholders learn their roles. The planning elements identify what an organization’s Standard Operating Procedures (SOPs) or Emergency Operations Plans (EOPs) should include for ensuring that contingencies are in place for delivering the capability during a large-scale disaster." [fema.gov/ plan]
The arrow ring chart example "National Preparedness Cycle" was created using the ConceptDraw PRO diagramming and vector drawing software extended with the Target and Circular Diagrams solution from the Marketing area of ConceptDraw Solution Park.
www.conceptdraw.com/ solution-park/ marketing-target-and-circular-diagrams
Arrow ring chart
Circular Flow Diagram Template

Examples of Flowcharts, Org Charts and More


Pie Chart Examples and Templates

The vector stencils library Comparison charts contains 4 Live Objects: Horizontal bar chart, Column chart (Vertical bar chart), Line chart and Dot plot (Scatter chart).
The vector stencils library Comparison indicators contains 7 Live Objects:
Two column indicator, Two bubbles indicator, Scales indicator, Left and right arrows indicator, Up and down arrows indicator, Two up arrows indicator.
The ConceptDraw Live Objects are ready-to-use templates of charts and visual indicators for dashboard design. You can set data source file for Each Live Object, and your charts or indicators will represents actual data from the data source files, and change their appearance with changing of the data in source files. The comparison charts and indicators are useful to compare and rank of your data by categories.
Use the design elements libraries "Comparison charts" and "Comparison indicators" to create your own business visual dashboards using the ConceptDraw PRO diagramming and vector drawing software.
The example "Design elements - Comparison charts and indicators" is included in the Comparison Dashboard solution from the area "What is a Dashboard" of ConceptDraw Solution Park.
Data comparison charts and visual indicators

This circular arrows diagram sample shows business process management life cycle.
It was designed on the base of the Wikimedia Commons file: Business Process Management Life-Cycle.svg. [commons.wikimedia.org/ wiki/ File:Business_ Process_ Management_ Life-Cycle.svg]
This file is licensed under the Creative Commons Attribution-Share Alike 3.0 Unported license. [creativecommons.org/ licenses/ by-sa/ 3.0/ deed.en]
"BPM life-cycle.
Business process management activities can be grouped into six categories: vision, design, modeling, execution, monitoring, and optimization.
Functions are designed around the strategic vision and goals of an organization. Each function is attached with a list of processes. Each functional head in an organization is responsible for certain sets of processes made up of tasks which are to be executed and reported as planned. Multiple processes are aggregated to function accomplishments and multiple functions are aggregated to achieve organizational goals." [Business process management. Wikipedia]
The arrow donut chart example "BPM life cycle" was created using the ConceptDraw PRO diagramming and vector drawing software extended with the Circular Arrows Diagrams solution from the area "What is a Diagram" of ConceptDraw Solution Park.
Circular arrows diagram

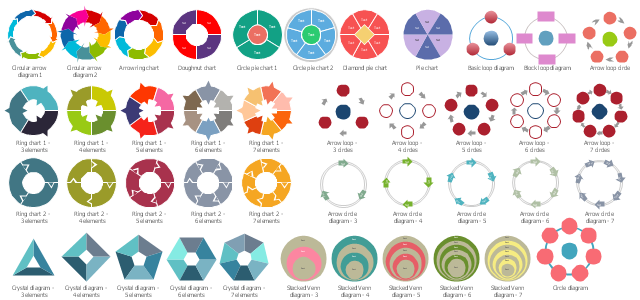
The vector stencils library "Circular diagrams" contains 42 templates of circular diagrams: circular arrow diagram, circular motion diagram, arrow ring chart, doughnut chart (donut chart), circle pie chart, diamond pie chart, circle diagram, pie chart, ring chart, loop diagram, block loop diagram, arrow loop circle, crystal diagram, triangular diagram, diamond diagram, pentagon diagram, hexagon diagram, heptagon diagram, cycle diagram (cycle chart), stacked Venn diagram (onion diagram), arrow circle diagram.
The example of marketing diagrams templates "Design elements - Circular diagrams" for the ConceptDraw PRO diagramming and vector drawing software is included the Target and Circular Diagrams solution from the Marketing area of ConceptDraw Solution Park.
www.conceptdraw.com/ solution-park/ marketing-target-and-circular-diagrams
Circular diagrams templates
Donut Chart Templates

Circular Arrows

 Basic Pie Charts
This solution extends the capabilities of ConceptDraw DIAGRAM (or later) with templates, samples, and a library of vector stencils for drawing pie and donut charts.
Technical Flow Chart Example

The vector stencils library "Circular arrows diagrams" contains 20 templates of circular arrows diagrams, arrow donut charts and arrow circle diagrams for the ConceptDraw PRO diagramming and vector drawing software.
Circular Arrows Diagrams (Segmented Cycle Diagrams) visualize a sequence of steps, tasks, or events as a circular flow. They are used to visualize a processing cycle in marketing and management documents and presentations.
The example "Design elements - Circular arrows diagrams" is included in the Circular Arrows Diagrams solution from the area "What is a Diagram" of ConceptDraw Solution Park.
Arrow circle diagram templates
Flowchart Components


How to Create a Pie Chart

 Pie Charts
Pie Charts are extensively used in statistics and business for explaining data and work results, in mass media for comparison (i.e. to visualize the percentage for the parts of one total), and in many other fields. The Pie Charts solution for ConceptDraw DIAGRAM offers powerful drawing tools, varied templates, samples, and a library of vector stencils for simple construction and design of Pie Charts, Donut Chart, and Pie Graph Worksheets.
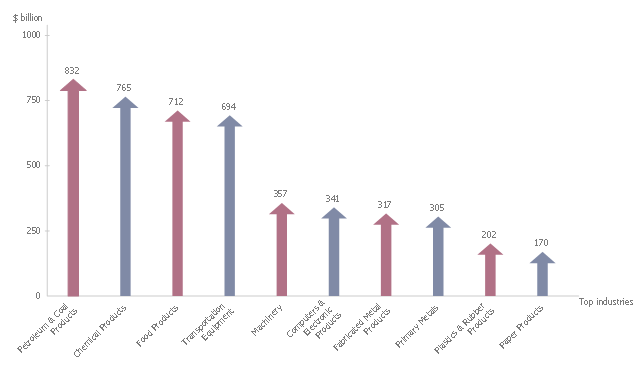
This arrows bar chart example shows the total value of manufacturers' shipments. It was drawn on the base of the infographics "Inside America's Economic Machine" from the website of the United States Census Bureau.
[census.gov/ how/ img/ Econ_ Infographic.jpg]
"The Advance Report on Durable Goods Manufacturer's Shipments, Inventories and Orders, or the Durable Goods Report, provides data on new orders received from more than 4,000 manufacturers of durable goods, which are generally defined as higher-priced capital goods orders with a useful life of three years or more, such as cars, semiconductor equipment and turbines.More than 85 industries are represented in the sample, which covers the entire United States." [Economic Indicators: Durable Goods Report. R. Barnes. investopedia.com/ university/ releases/ durablegoods.asp]
The arrow graph example "Total value of manufacturers' shipments" was created using the ConceptDraw PRO diagramming and vector drawing software extended with the Basic Picture Graphs solution from the Graphs and Charts area of ConceptDraw Solution Park.
Arrows bar chart
- How to Draw the Different Types of Pie Charts | Circular arrows ...
- Arrow circle chart - Template | How to Draw a Circular Arrows ...
- Arrows Bar Chart
- Circular arrows diagrams - Vector stencils library | Triangle scheme ...
- Pie Charts | Circle Spoke Diagram Template | Pie Chart Software ...
- Arrow circle chart - Template | Donut chart - Template | Pie charts ...
- Circular arrows diagrams - Vector stencils library | Pie Chart ...
- How to Draw the Different Types of Pie Charts | How to Create a Pie ...
- National Preparedness Cycle - Arrow ring chart | Virtuous circle ...
- Circular Arrows Diagrams | Arrow circle chart - Template | How to ...
- Circle Spoke Diagram Template | Circular Flow Diagram Template ...
- Arrow circle chart - Template | How to Draw the Different Types of ...
- Circular Arrow Chart
- Chart Examples | Virtuous circle (management) - Ring chart ...
- How to Draw a Circular Arrows Diagram | Circular Arrow | Circular ...
- Circular arrows diagrams - Vector stencils library | Circular diagrams ...
- HR arrows - Vector stencils library | Chart Examples | Chart ...
- Virtuous circle (management) - Ring chart | How to Draw the ...
- Circular Arrow
- Donut Chart Templates | Pie Chart Software | Doughnut chart ...