"In elementary algebra, a quadratic equation (from the Latin quadratus for "square") is any equation having the form
ax^2+bx+c=0
where x represents an unknown, and a, b, and c are constants with a not equal to 0. If a = 0, then the equation is linear, not quadratic. The constants a, b, and c are called, respectively, the quadratic coefficient, the linear coefficient and the constant or free term.
Because the quadratic equation involves only one unknown, it is called "univariate". The quadratic equation only contains powers of x that are non-negative integers, and therefore it is a polynomial equation, and in particular it is a second degree polynomial equation since the greatest power is two.
Quadratic equations can be solved by a process known in American English as factoring and in other varieties of English as factorising, by completing the square, by using the quadratic formula, or by graphing." [Quadratic equation. Wikipedia]
The flowchart example "Solving quadratic equation algorithm" was created using the ConceptDraw PRO diagramming and vector drawing software extended with the Mathematics solution from the Science and Education area of ConceptDraw Solution Park.
Solving quadratic equation flow chart

Basic Diagramming


Mathematical Diagrams

HelpDesk
How to Purchase ConceptDraw Products for Academic/Nonprofit Institutions

 Mathematics
Mathematics solution extends ConceptDraw DIAGRAM software with templates, samples and libraries of vector stencils for drawing the mathematical illustrations, diagrams and charts.
Bar Diagram Math

Flowchart. What is Flowchart

Draw Fishbone Diagram on MAC Software

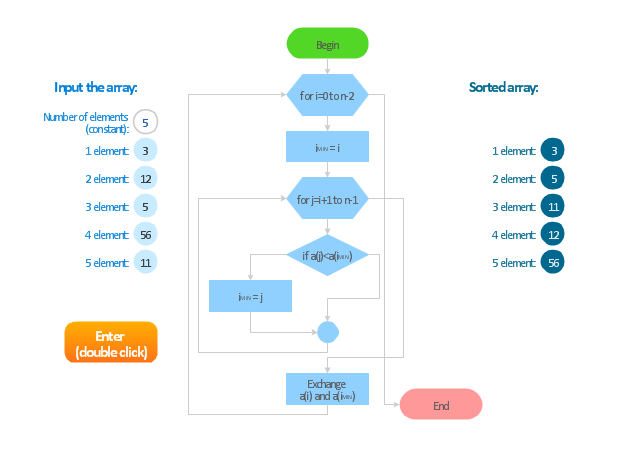
"In mathematics and computer science, an algorithm ... is a step-by-step procedure for calculations. Algorithms are used for calculation, data processing, and automated reasoning.
An algorithm is an effective method expressed as a finite list of well-defined instructions for calculating a function. Starting from an initial state and initial input (perhaps empty), the instructions describe a computation that, when executed, proceeds through a finite number of well-defined successive states, eventually producing "output" and terminating at a final ending state. The transition from one state to the next is not necessarily deterministic; some algorithms, known as randomized algorithms, incorporate random input." [Algorithm. Wikipedia]
The algorithm flow chart example "Selection sorting method" was created using the ConceptDraw PRO diagramming and vector drawing software extended with the Flowcharts solution from the area "What is a Diagram" of ConceptDraw Solution Park.
Flowchart - Selection sorting method
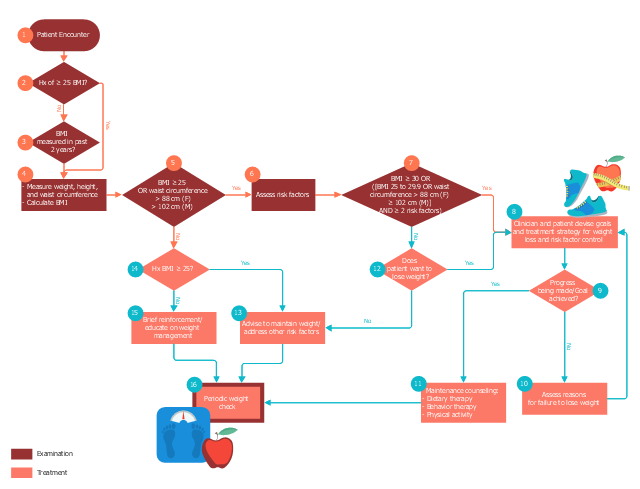
This medical flowchart sample shows assessment and treatment algorithm for overweight and obesity.
It was drawn on the base of Wikimedia Commons file: Assessment and treatment algorithm for overweight and obesity.png. [commons.wikimedia.org/ wiki/ File:Assessment_ and_ treatment_ algorithm_ for_ overweight_ and_ obesity.png]
"A medical algorithm is any computation, formula, statistical survey, nomogram, or look-up table, useful in healthcare. Medical algorithms include decision tree approaches to healthcare treatment (e.g., if symptoms A, B, and C are evident, then use treatment X) and also less clear-cut tools aimed at reducing or defining uncertainty." [Medical algorithm. Wikipedia]
The medical flow chart example "Assessment and treatment algorithm for overweight and obesity" was designed using ConceptDraw PRO software extended with Healthcare Workflow Diagrams solution from Business Processes area of ConceptDraw Solution Park.
Medical flowchart
"In mathematics, the Euclidean algorithm, or Euclid's algorithm, is a method for computing the greatest common divisor (GCD) of two (usually positive) integers, also known as the greatest common factor (GCF) or highest common factor (HCF). ...
The GCD of two positive integers is the largest integer that divides both of them without leaving a remainder (the GCD of two integers in general is defined in a more subtle way).
In its simplest form, Euclid's algorithm starts with a pair of positive integers, and forms a new pair that consists of the smaller number and the difference between the larger and smaller numbers. The process repeats until the numbers in the pair are equal. That number then is the greatest common divisor of the original pair of integers.
The main principle is that the GCD does not change if the smaller number is subtracted from the larger number. ... Since the larger of the two numbers is reduced, repeating this process gives successively smaller numbers, so this repetition will necessarily stop sooner or later - when the numbers are equal (if the process is attempted once more, one of the numbers will become 0)." [Euclidean algorithm. Wikipedia]
The flowchart example "Euclidean algorithm" was created using the ConceptDraw PRO diagramming and vector drawing software extended with the Mathematics solution from the Science and Education area of ConceptDraw Solution Park.
Euclid's algorithm flow chart

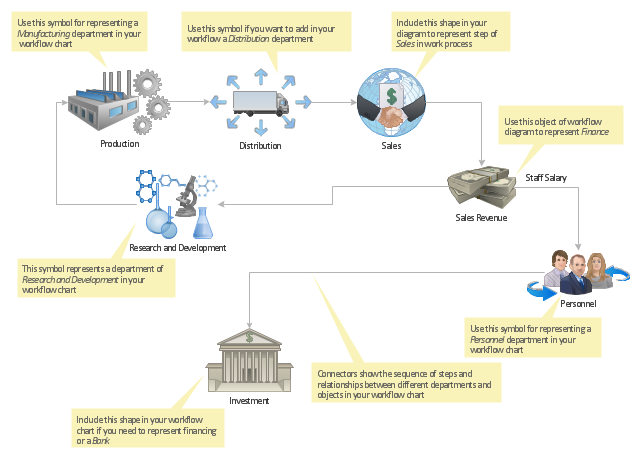
"Workflow components.
A workflow can usually be described using formal or informal flow diagramming techniques, showing directed flows between processing steps. Single processing steps or components of a workflow can basically be defined by three parameters:
(1) input description: the information, material and energy required to complete the step,
(2) transformation rules, algorithms, which may be carried out by associated human roles or machines, or a combination,
(3) output description: the information, material and energy produced by the step and provided as input to downstream steps.
Components can only be plugged together if the output of one previous (set of) component(s) is equal to the mandatory input requirements of the following component. Thus, the essential description of a component actually comprises only in- and output that are described fully in terms of data types and their meaning (semantics). The algorithms' or rules' description need only be included when there are several alternative ways to transform one type of input into one type of output – possibly with different accuracy, speed, etc.
When the components are non-local services that are invoked remotely via a computer network, such as Web services, additional descriptors (such as QoS and availability) also must be considered." [Workflow. Wikipedia]
The workflow diagram template for the ConceptDraw PRO diagramming and vector drawing software is included in the Workflow Diagrams solution from the Business Processes area of ConceptDraw Solution Park.
Workflow diagram template
This work flow chart sample was redesigned from the picture "Weather Forecast" from the article "Simulation Workflows".
[iaas.uni-stuttgart.de/ forschung/ projects/ simtech/ sim-workflows.php]
"(1) The weather is predicted for a particular geological area. Hence, the workflow is fed with a model of the geophysical environment of ground, air and water for a requested area.
(2) Over a specified period of time (e.g. 6 hours) several different variables are measured and observed. Ground stations, ships, airplanes, weather balloons, satellites and buoys measure the air pressure, air/ water temperature, wind velocity, air humidity, vertical temperature profiles, cloud velocity, rain fall, and more.
(3) This data needs to be collected from the different sources and stored for later access.
(4) The collected data is analyzed and transformed into a common format (e.g. Fahrenheit to Celsius scale). The normalized values are used to create the current state of the atmosphere.
(5) Then, a numerical weather forecast is made based on mathematical-physical models (e.g. GFS - Global Forecast System, UKMO - United Kingdom MOdel, GME - global model of Deutscher Wetterdienst). The environmental area needs to be discretized beforehand using grid cells. The physical parameters measured in Step 2 are exposed in 3D space as timely function. This leads to a system of partial differential equations reflecting the physical relations that is solved numerically.
(6) The results of the numerical models are complemented with a statistical interpretation (e.g. with MOS - Model-Output-Statistics). That means the forecast result of the numerical models is compared to statistical weather data. Known forecast failures are corrected.
(7) The numerical post-processing is done with DMO (Direct Model Output): the numerical results are interpolated for specific geological locations.
(8) Additionally, a statistical post-processing step removes failures of measuring devices (e.g. using KALMAN filters).
(9) The statistical interpretation and the numerical results are then observed and interpreted by meteorologists based on their subjective experiences.
(10) Finally, the weather forecast is visualized and presented to interested people." [iaas.uni-stuttgart.de/ forschung/ projects/ simtech/ sim-workflows.php]
The example "Workflow diagram - Weather forecast" was drawn using the ConceptDraw PRO diagramming and vector drawing software extended with the Workflow Diagrams solution from the Business Processes area of ConceptDraw Solution Park.
Work flow chart

Simple Drawing Applications for Mac

Column Chart Template

"In mathematics, the Euclidean algorithm, or Euclid's algorithm, is a method for computing the greatest common divisor (GCD) of two (usually positive) integers, also known as the greatest common factor (GCF) or highest common factor (HCF). ...
The GCD of two positive integers is the largest integer that divides both of them without leaving a remainder (the GCD of two integers in general is defined in a more subtle way).
In its simplest form, Euclid's algorithm starts with a pair of positive integers, and forms a new pair that consists of the smaller number and the difference between the larger and smaller numbers. The process repeats until the numbers in the pair are equal. That number then is the greatest common divisor of the original pair of integers.
The main principle is that the GCD does not change if the smaller number is subtracted from the larger number. ... Since the larger of the two numbers is reduced, repeating this process gives successively smaller numbers, so this repetition will necessarily stop sooner or later - when the numbers are equal (if the process is attempted once more, one of the numbers will become 0)." [Euclidean algorithm. Wikipedia]
The flowchart example "Euclidean algorithm" was created using the ConceptDraw PRO diagramming and vector drawing software extended with the Mathematics solution from the Science and Education area of ConceptDraw Solution Park.
The GCD of two positive integers is the largest integer that divides both of them without leaving a remainder (the GCD of two integers in general is defined in a more subtle way).
In its simplest form, Euclid's algorithm starts with a pair of positive integers, and forms a new pair that consists of the smaller number and the difference between the larger and smaller numbers. The process repeats until the numbers in the pair are equal. That number then is the greatest common divisor of the original pair of integers.
The main principle is that the GCD does not change if the smaller number is subtracted from the larger number. ... Since the larger of the two numbers is reduced, repeating this process gives successively smaller numbers, so this repetition will necessarily stop sooner or later - when the numbers are equal (if the process is attempted once more, one of the numbers will become 0)." [Euclidean algorithm. Wikipedia]
The flowchart example "Euclidean algorithm" was created using the ConceptDraw PRO diagramming and vector drawing software extended with the Mathematics solution from the Science and Education area of ConceptDraw Solution Park.
Euclid's algorithm flow chart
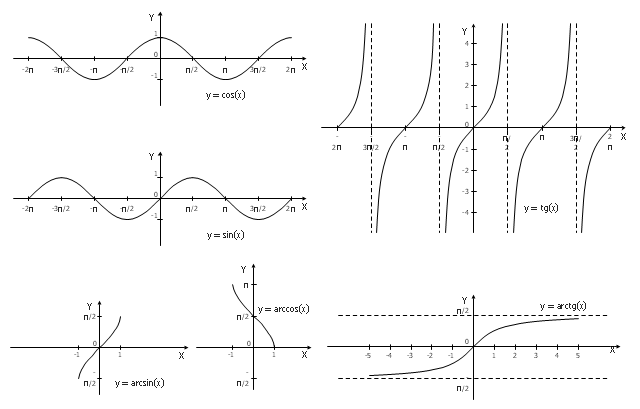
The vector stencils library "Trigonometric functions" contains 8 shapes of trigonometrical and inverse trigonometrical functions graphs.
"In mathematics, the trigonometric functions (also called the circular functions) are functions of an angle. They relate the angles of a triangle to the lengths of its sides. Trigonometric functions are important in the study of triangles and modeling periodic phenomena, among many other applications.
The most familiar trigonometric functions are the sine, cosine, and tangent. In the context of the standard unit circle with radius 1 unit, where a triangle is formed by a ray originating at the origin and making some angle with the x-axis, the sine of the angle gives the length of the y-component (the opposite to the angle or the rise) of the triangle, the cosine gives the length of the x-component (the adjacent of the angle or the run), and the tangent function gives the slope (y-component divided by the x-component). More precise definitions are detailed below. Trigonometric functions are commonly defined as ratios of two sides of a right triangle containing the angle, and can equivalently be defined as the lengths of various line segments from a unit circle. More modern definitions express them as infinite series or as solutions of certain differential equations, allowing their extension to arbitrary positive and negative values and even to complex numbers." [Trigonometric functions. Wikipedia]
The shapes example "Design elements - Trigonometric functions" was created using the ConceptDraw PRO diagramming and vector drawing software extended with the Mathematics solution from the Science and Education area of ConceptDraw Solution Park.
Trigonometrical and inverse trigonometrical functions - Graphs
"In mathematics and computer science, an algorithm ... is a step-by-step procedure for calculations. Algorithms are used for calculation, data processing, and automated reasoning.
An algorithm is an effective method expressed as a finite list of well-defined instructions for calculating a function. Starting from an initial state and initial input (perhaps empty), the instructions describe a computation that, when executed, proceeds through a finite number of well-defined successive states, eventually producing "output" and terminating at a final ending state. The transition from one state to the next is not necessarily deterministic; some algorithms, known as randomized algorithms, incorporate random input." [Algorithm. Wikipedia]
The algorithm flow chart example "Selection sorting method" was created using the ConceptDraw PRO diagramming and vector drawing software extended with the Flowcharts solution from the area "What is a Diagram" of ConceptDraw Solution Park.
An algorithm is an effective method expressed as a finite list of well-defined instructions for calculating a function. Starting from an initial state and initial input (perhaps empty), the instructions describe a computation that, when executed, proceeds through a finite number of well-defined successive states, eventually producing "output" and terminating at a final ending state. The transition from one state to the next is not necessarily deterministic; some algorithms, known as randomized algorithms, incorporate random input." [Algorithm. Wikipedia]
The algorithm flow chart example "Selection sorting method" was created using the ConceptDraw PRO diagramming and vector drawing software extended with the Flowcharts solution from the area "What is a Diagram" of ConceptDraw Solution Park.
Flowchart - Selection sorting method


Types of Flowchart - Overview


- Solving quadratic equation algorithm - Flowchart | Mathematics ...
- Solving quadratic equation algorithm - Flowchart | Euclidean ...
- Solving quadratic equation algorithm - Flowchart | Algorithm And ...
- Solving quadratic equation algorithm - Flowchart | Algorithm To ...
- Solving quadratic equation algorithm - Flowchart | Write An ...
- Visual Basic Algorithm To Solve Quadratic Equation
- Solving quadratic equation algorithm - Flowchart | Draw Flowchart ...
- Solving quadratic equation algorithm - Flowchart | Ax2 Bx C = 0 ...
- Solving quadratic equation algorithm - Flowchart | Euclidean ...
- Solving quadratic equation algorithm - Flowchart | Basic ...
- Euclidean algorithm - Flowchart | Solving quadratic equation ...
- Solving quadratic equation algorithm - Flowchart | Solving quadratic ...
- Solving quadratic equation algorithm - Flowchart | Quadratic Fomular
- Solving quadratic equation algorithm - Flowchart | | Euclidean ...
- Solving quadratic equation algorithm - Flowchart | Draw A Flowchart ...
- Solving quadratic equation algorithm - Flowchart | By Using ...
- Solving quadratic equation algorithm - Flowchart | Basic Network ...
- Solving quadratic equation algorithm - Flowchart | | Algorithm Power ...
- Solving quadratic equation algorithm - Flowchart | An Algorithm For ...
- Solving quadratic equation algorithm - Flowchart | Chemistry ...